


Today, we are releasing one of our most important features since we made our data a product. Policies, market activity, insights, and everything related to how a nation positions itself on biodiversity credits. Welcome to the Countries dataset, the 6th addition to Bloom.
What we have built
Biodiversity credits do not form a single international and unified market yet - and might actually never do so. It is a galaxy of markets, engineered country by country, with public funds helping pilot projects, national policies shaping buyers’ trust, and compliance systems accelerating voluntary demand.
Building on that, we realized we had the ability to push it further than a status of who names credits. Using Bloom data, we could make it even more than a map. Of course, we also made a map, but took a different angle.
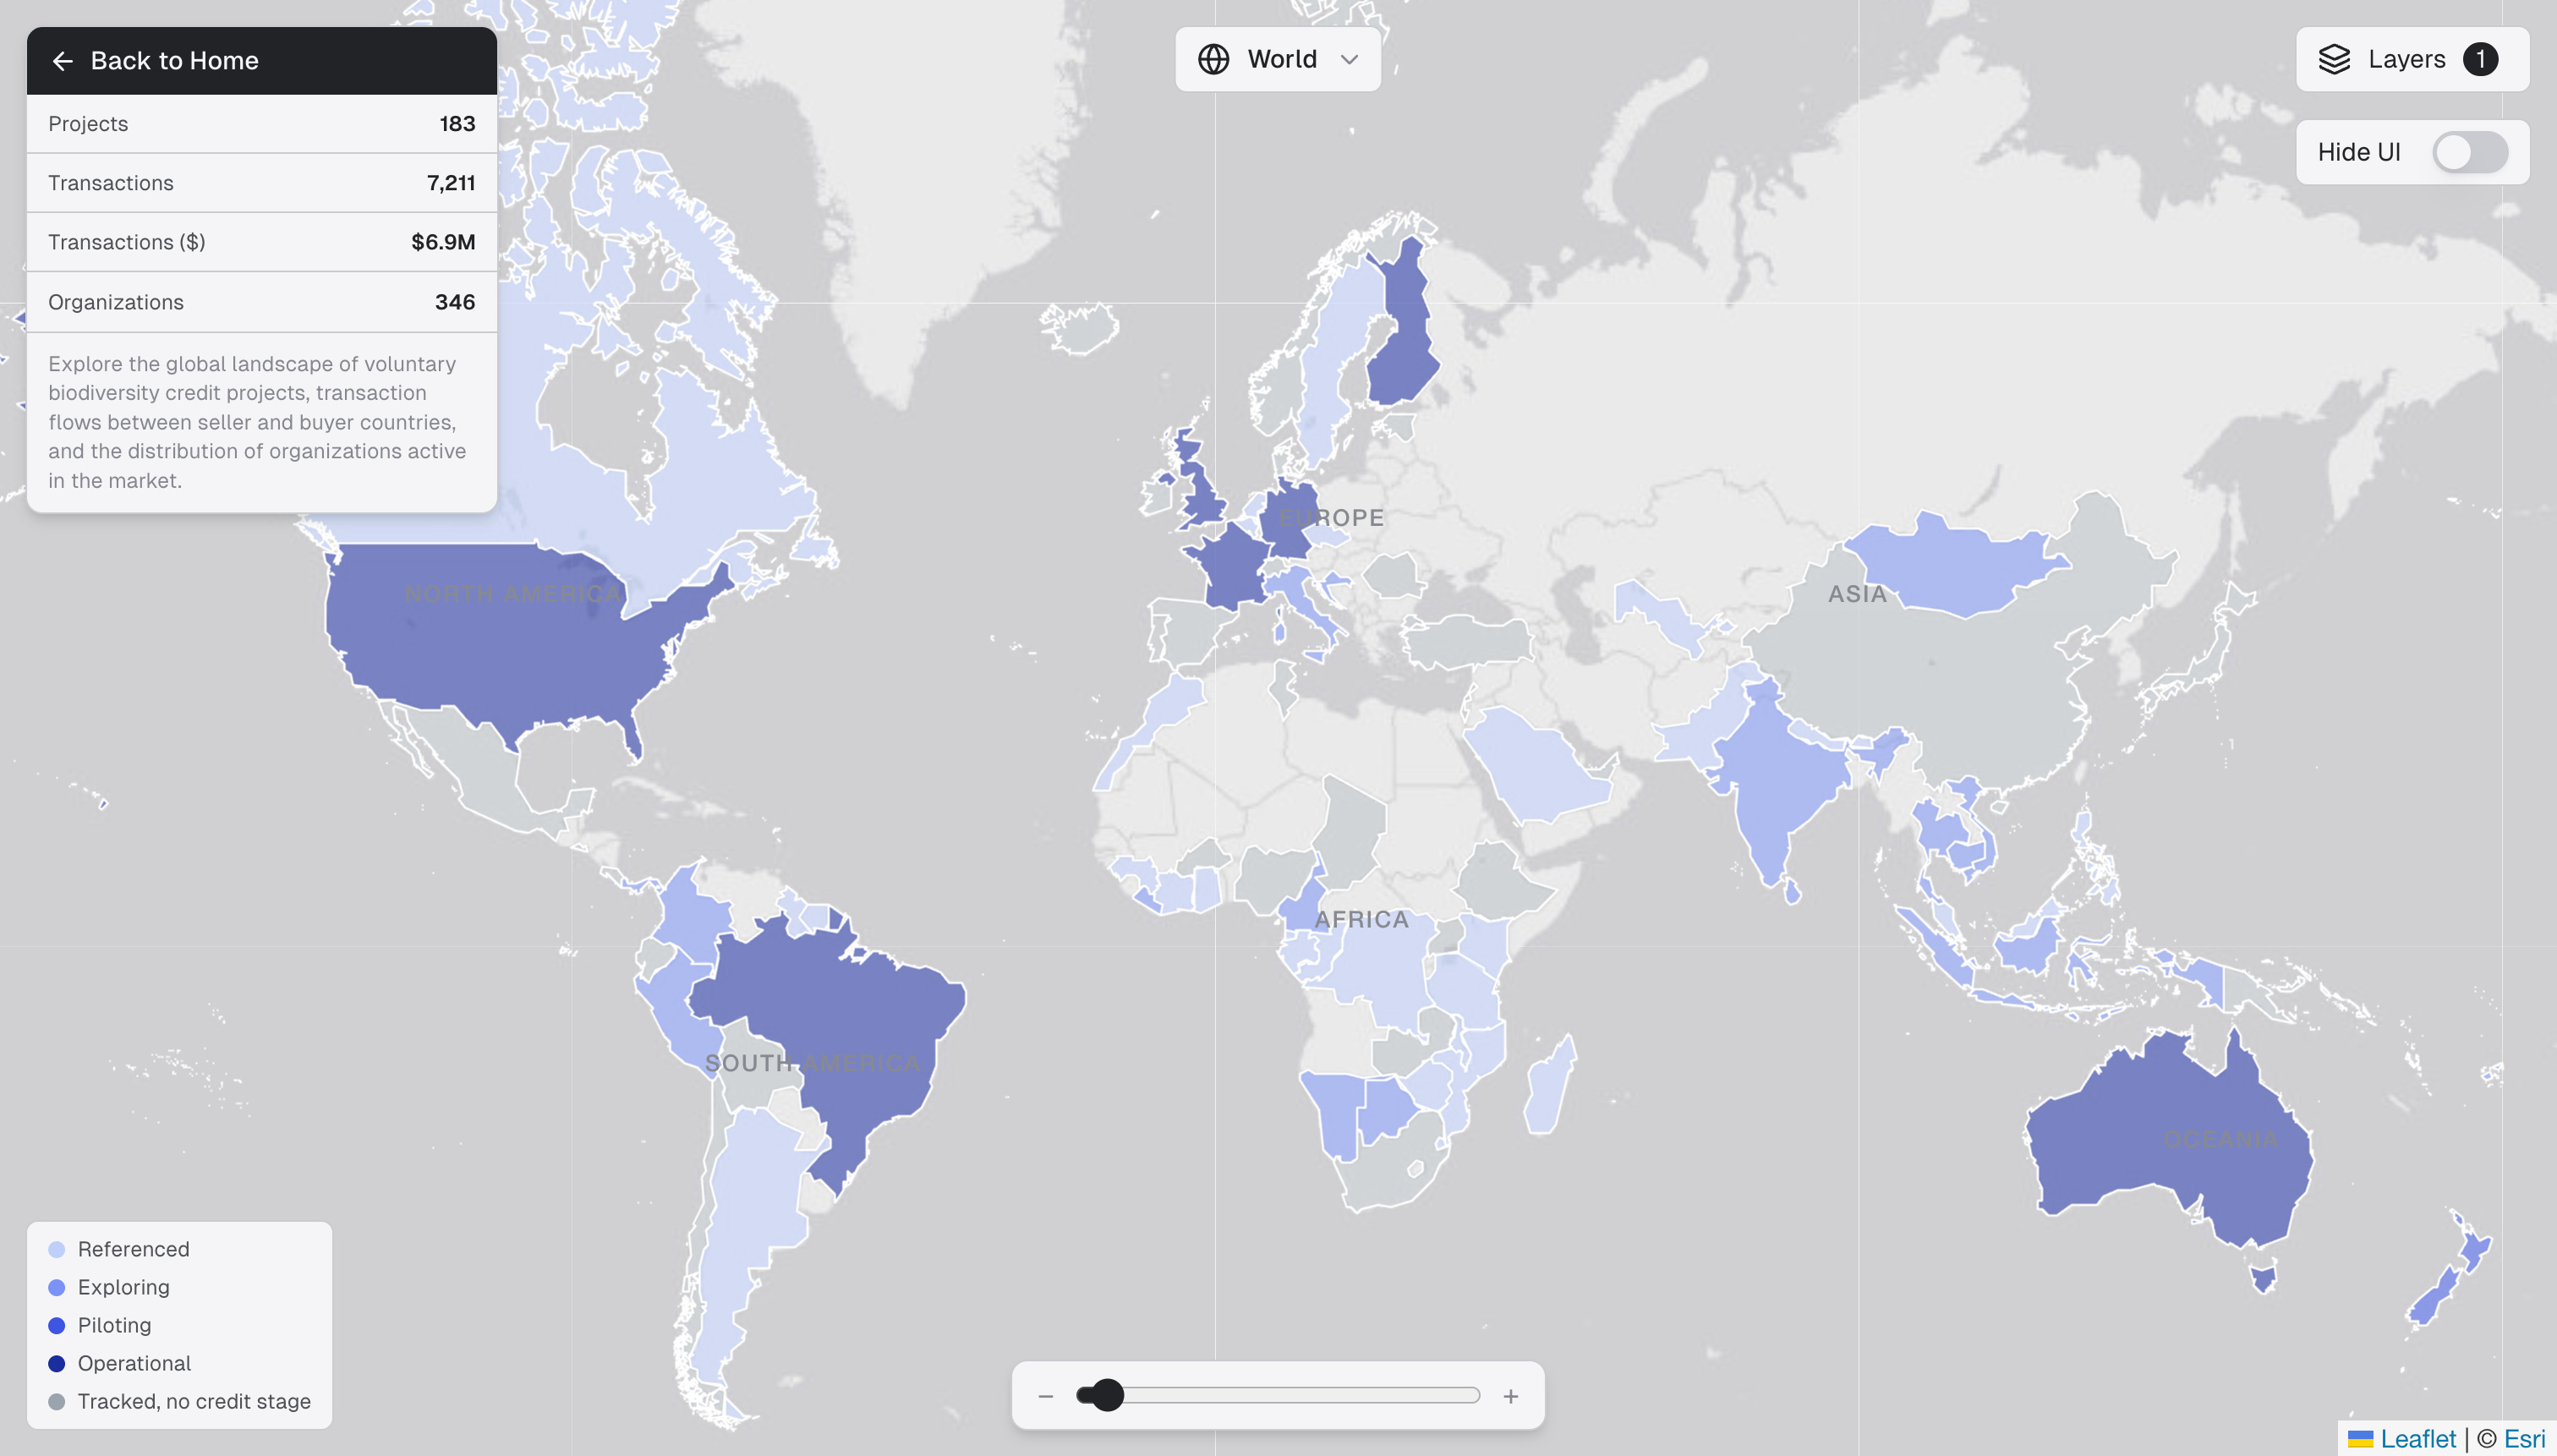
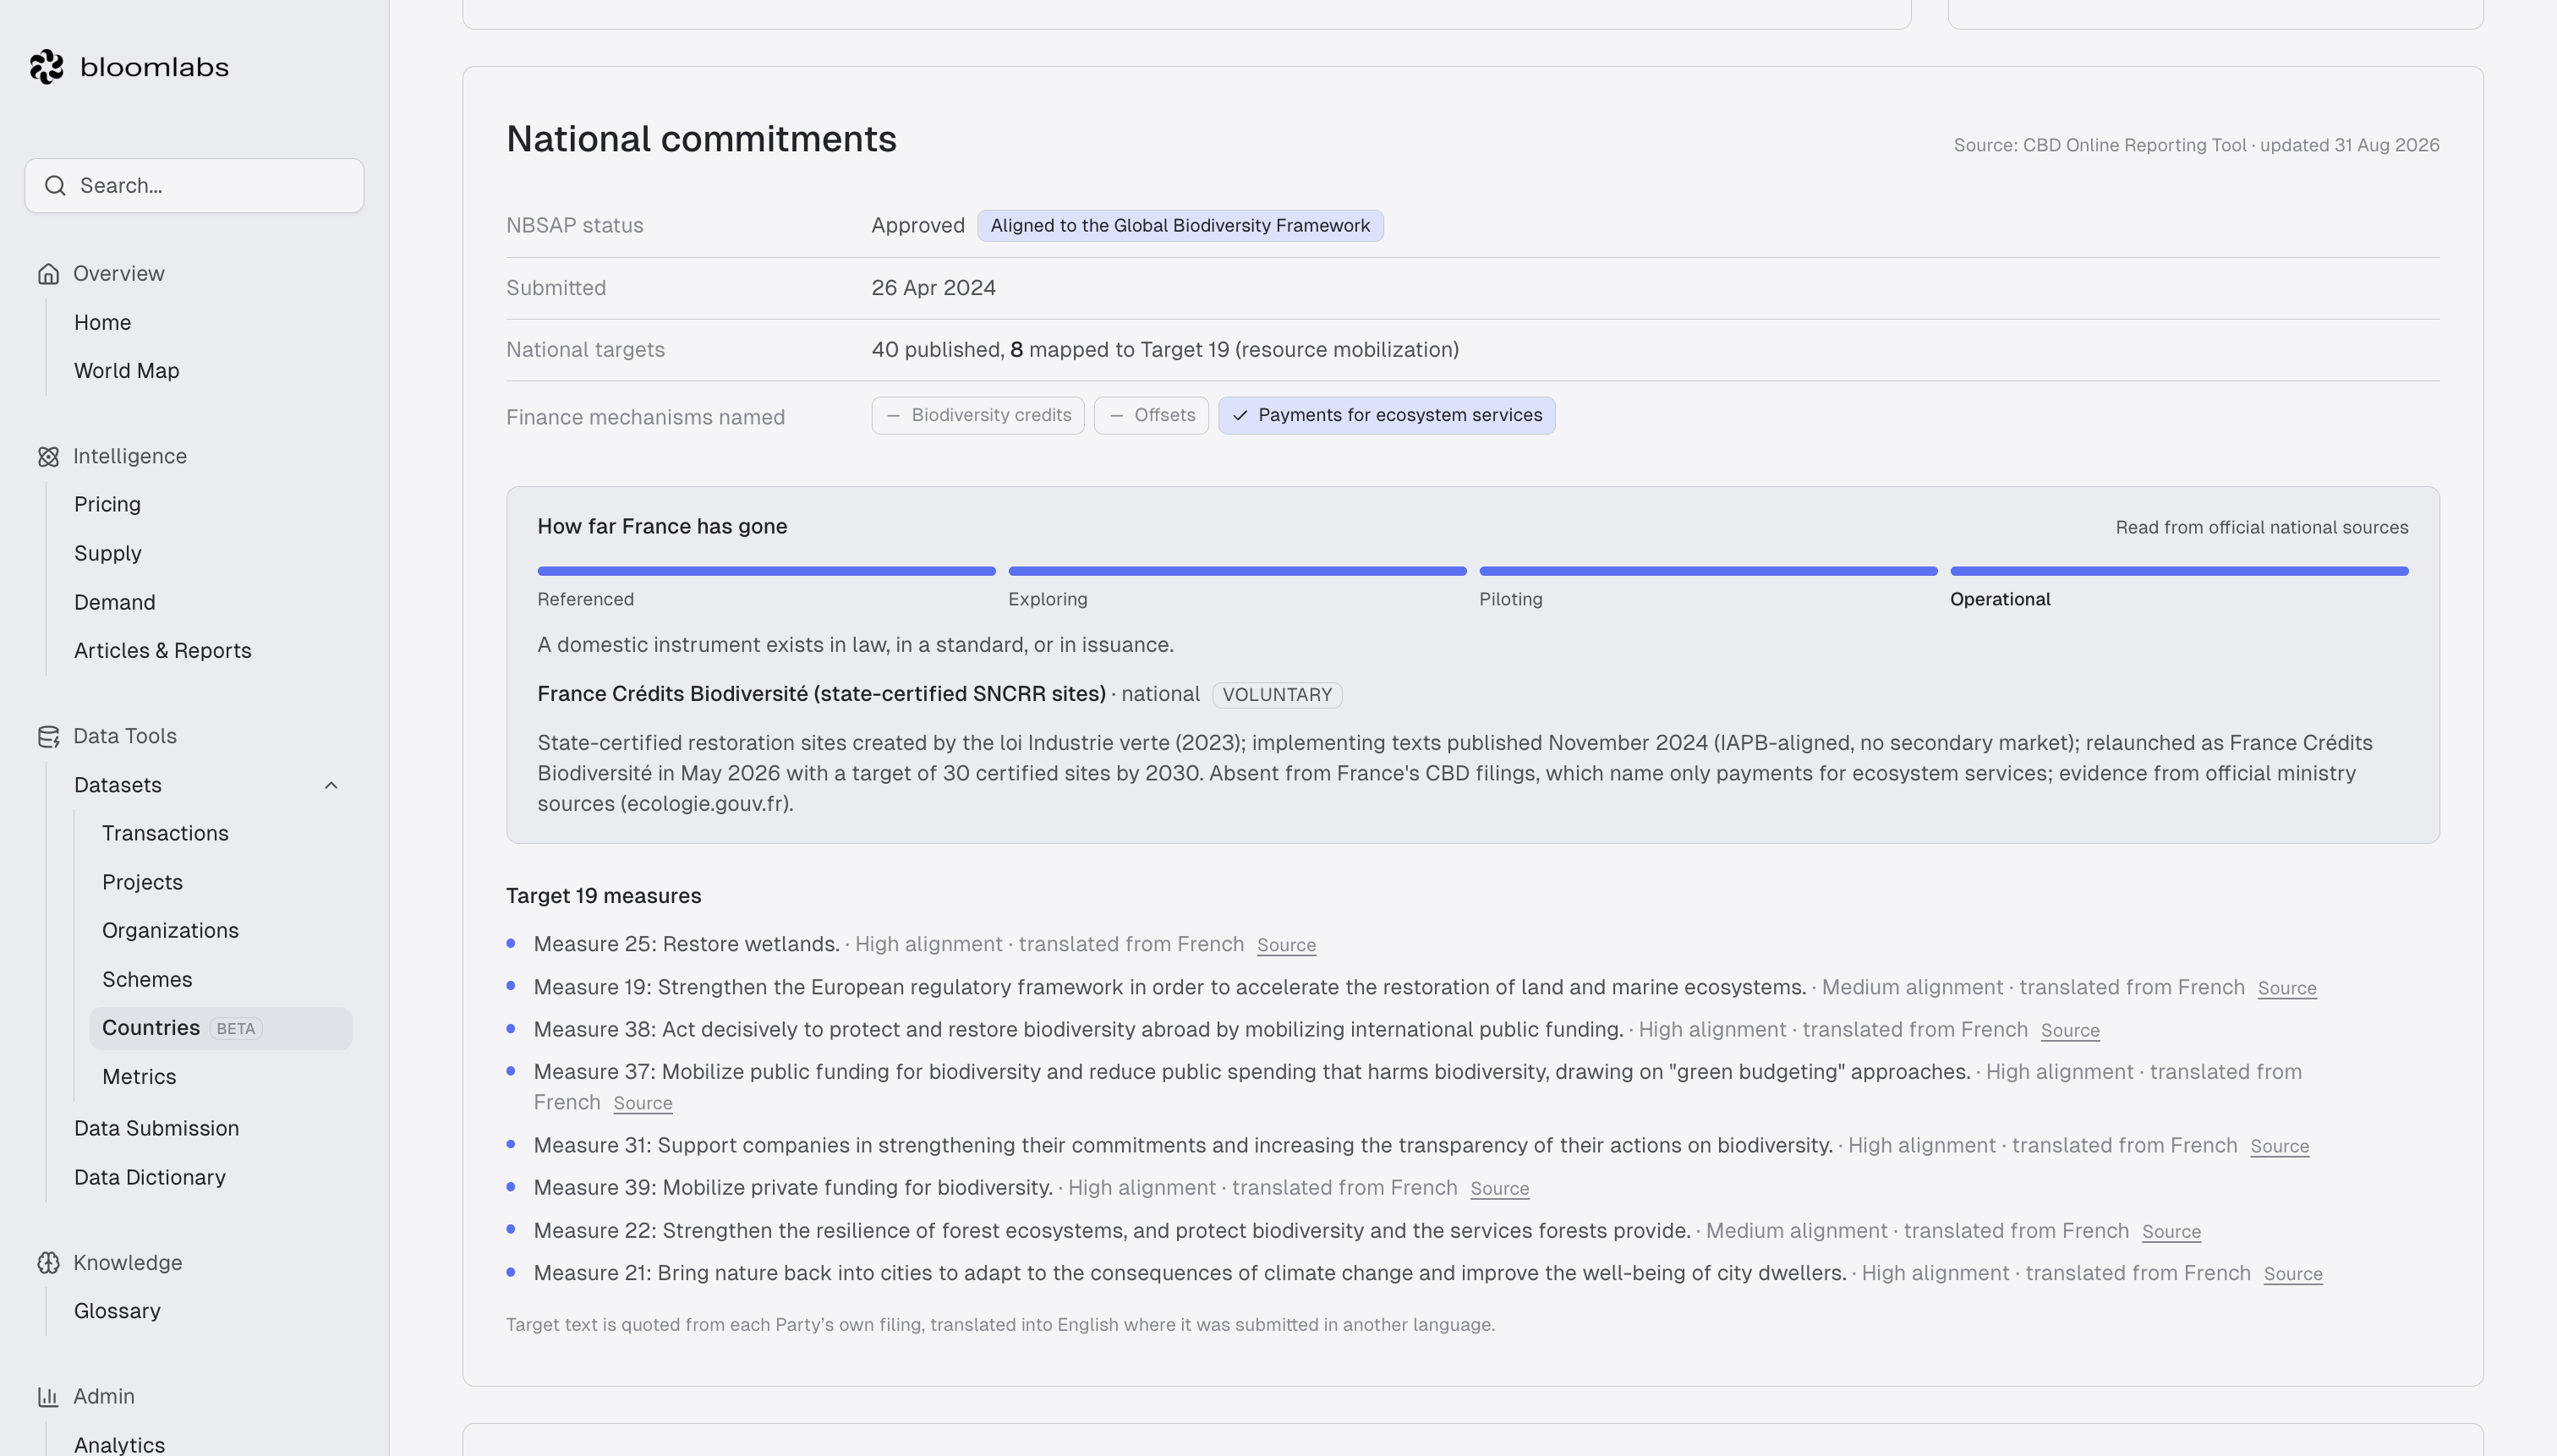
We designed a ladder to systematically categorize countries with the aim of answering “how far has country X actually gone with biodiversity credits?”. To pull this off, we needed evidence that a country was either referencing credits in national documents, exploring their implementation actively, piloting some projects on their soil, or already working with an operational - voluntary or compliance-based - credit system. The ladder naturally came from this progression.
The stage ladder
Referenced - credits are named as one funding option in national documents.
Exploring - the country is actively studying, assessing, consulting, or drafting an official credit system.
Piloting - biodiversity credit pilot projects are put to the test.
Operational - a domestic (national or regional) credit system exists in law, regulation, or state certification.
To assess those countries, we use a collection of data sources:
The CBD Online Reporting Tool gives us the National Biodiversity Strategies and Action Plans (NBSAPs), national targets, and National Reports to feed the policy side. We scan those 4,500+ documents and keep them in-house.
Deep continuous research provides us with up-to-date data we need to make those pages relevant. Every country is updated at least twice a month.
And, of course, Bloom market data closes the loop and provides the full policy-to-market view for every country.
We then aggregated everything into individual pages that, combined, form our new dataset.
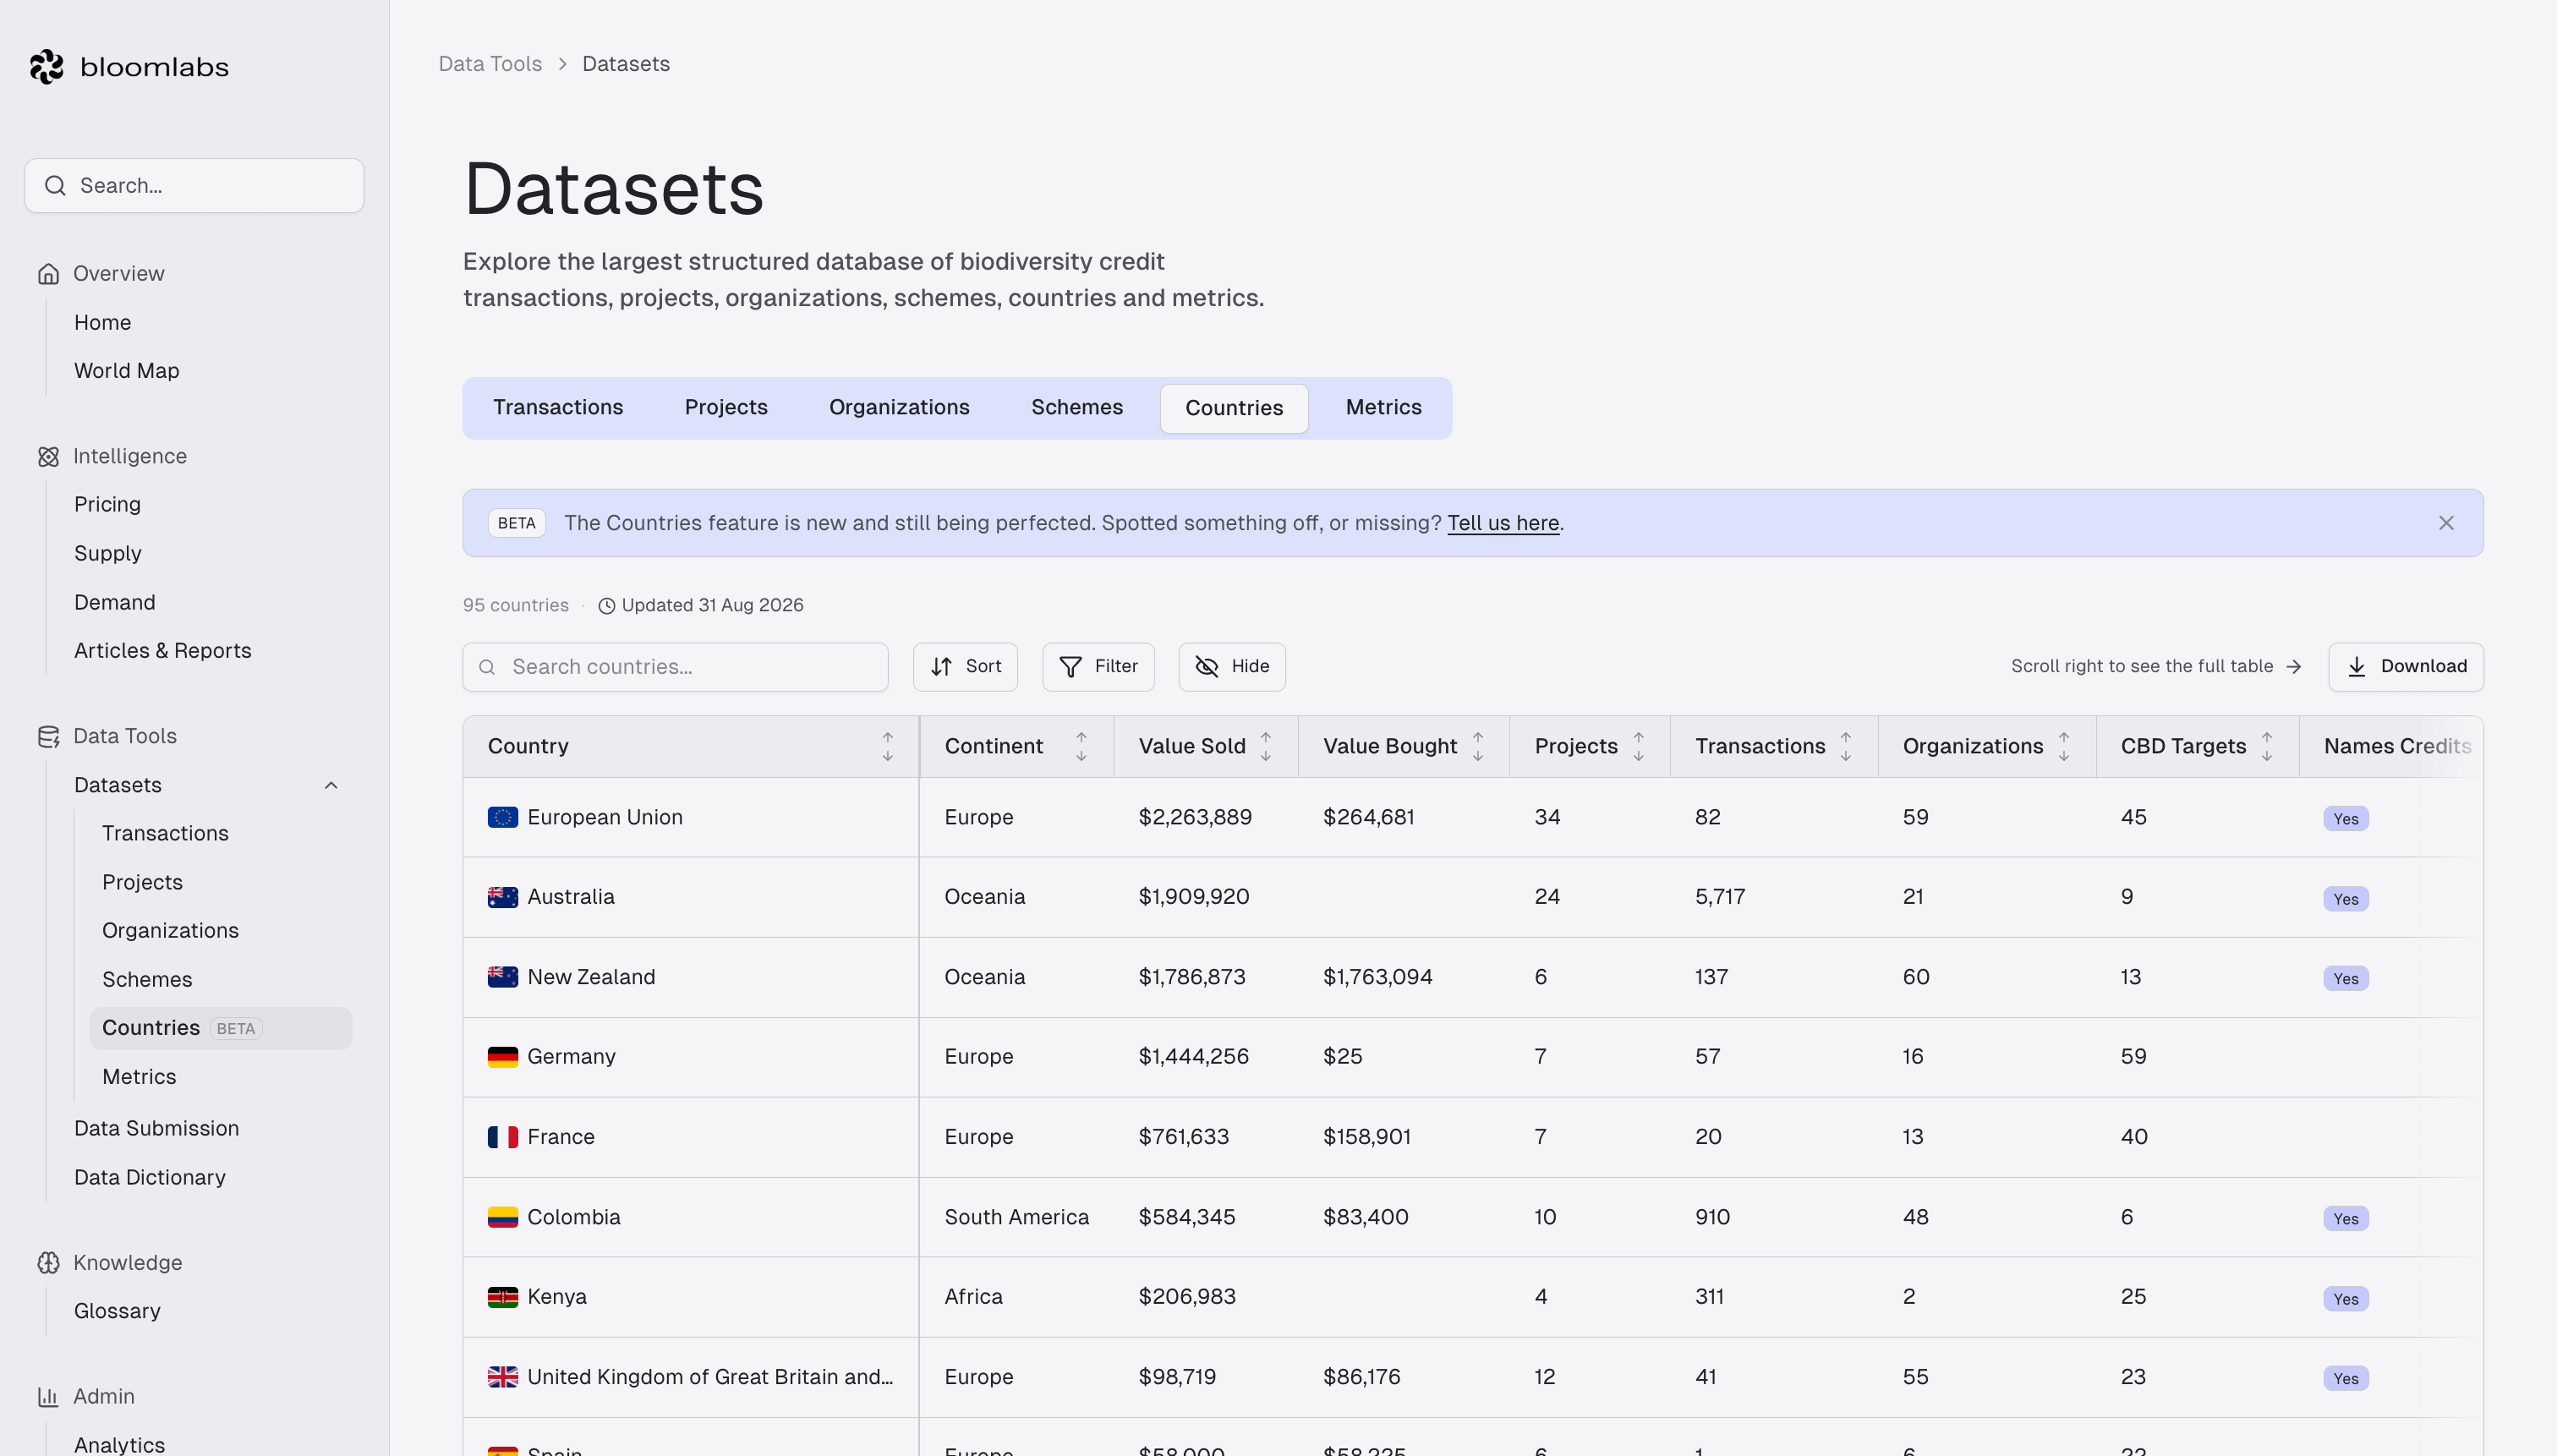
Those pages act as the one-stop shop for anyone interested in learning how a given country approaches credits. What it has implemented in the past, what it is doing now, and what it might do in the future.
They gather KPIs (projects, organizations, transactions, value sold and bought, average price/ha/yr), a focused country map, national commitments, detailed insights (policy / market approach / international position), and a timeline of relevant events.
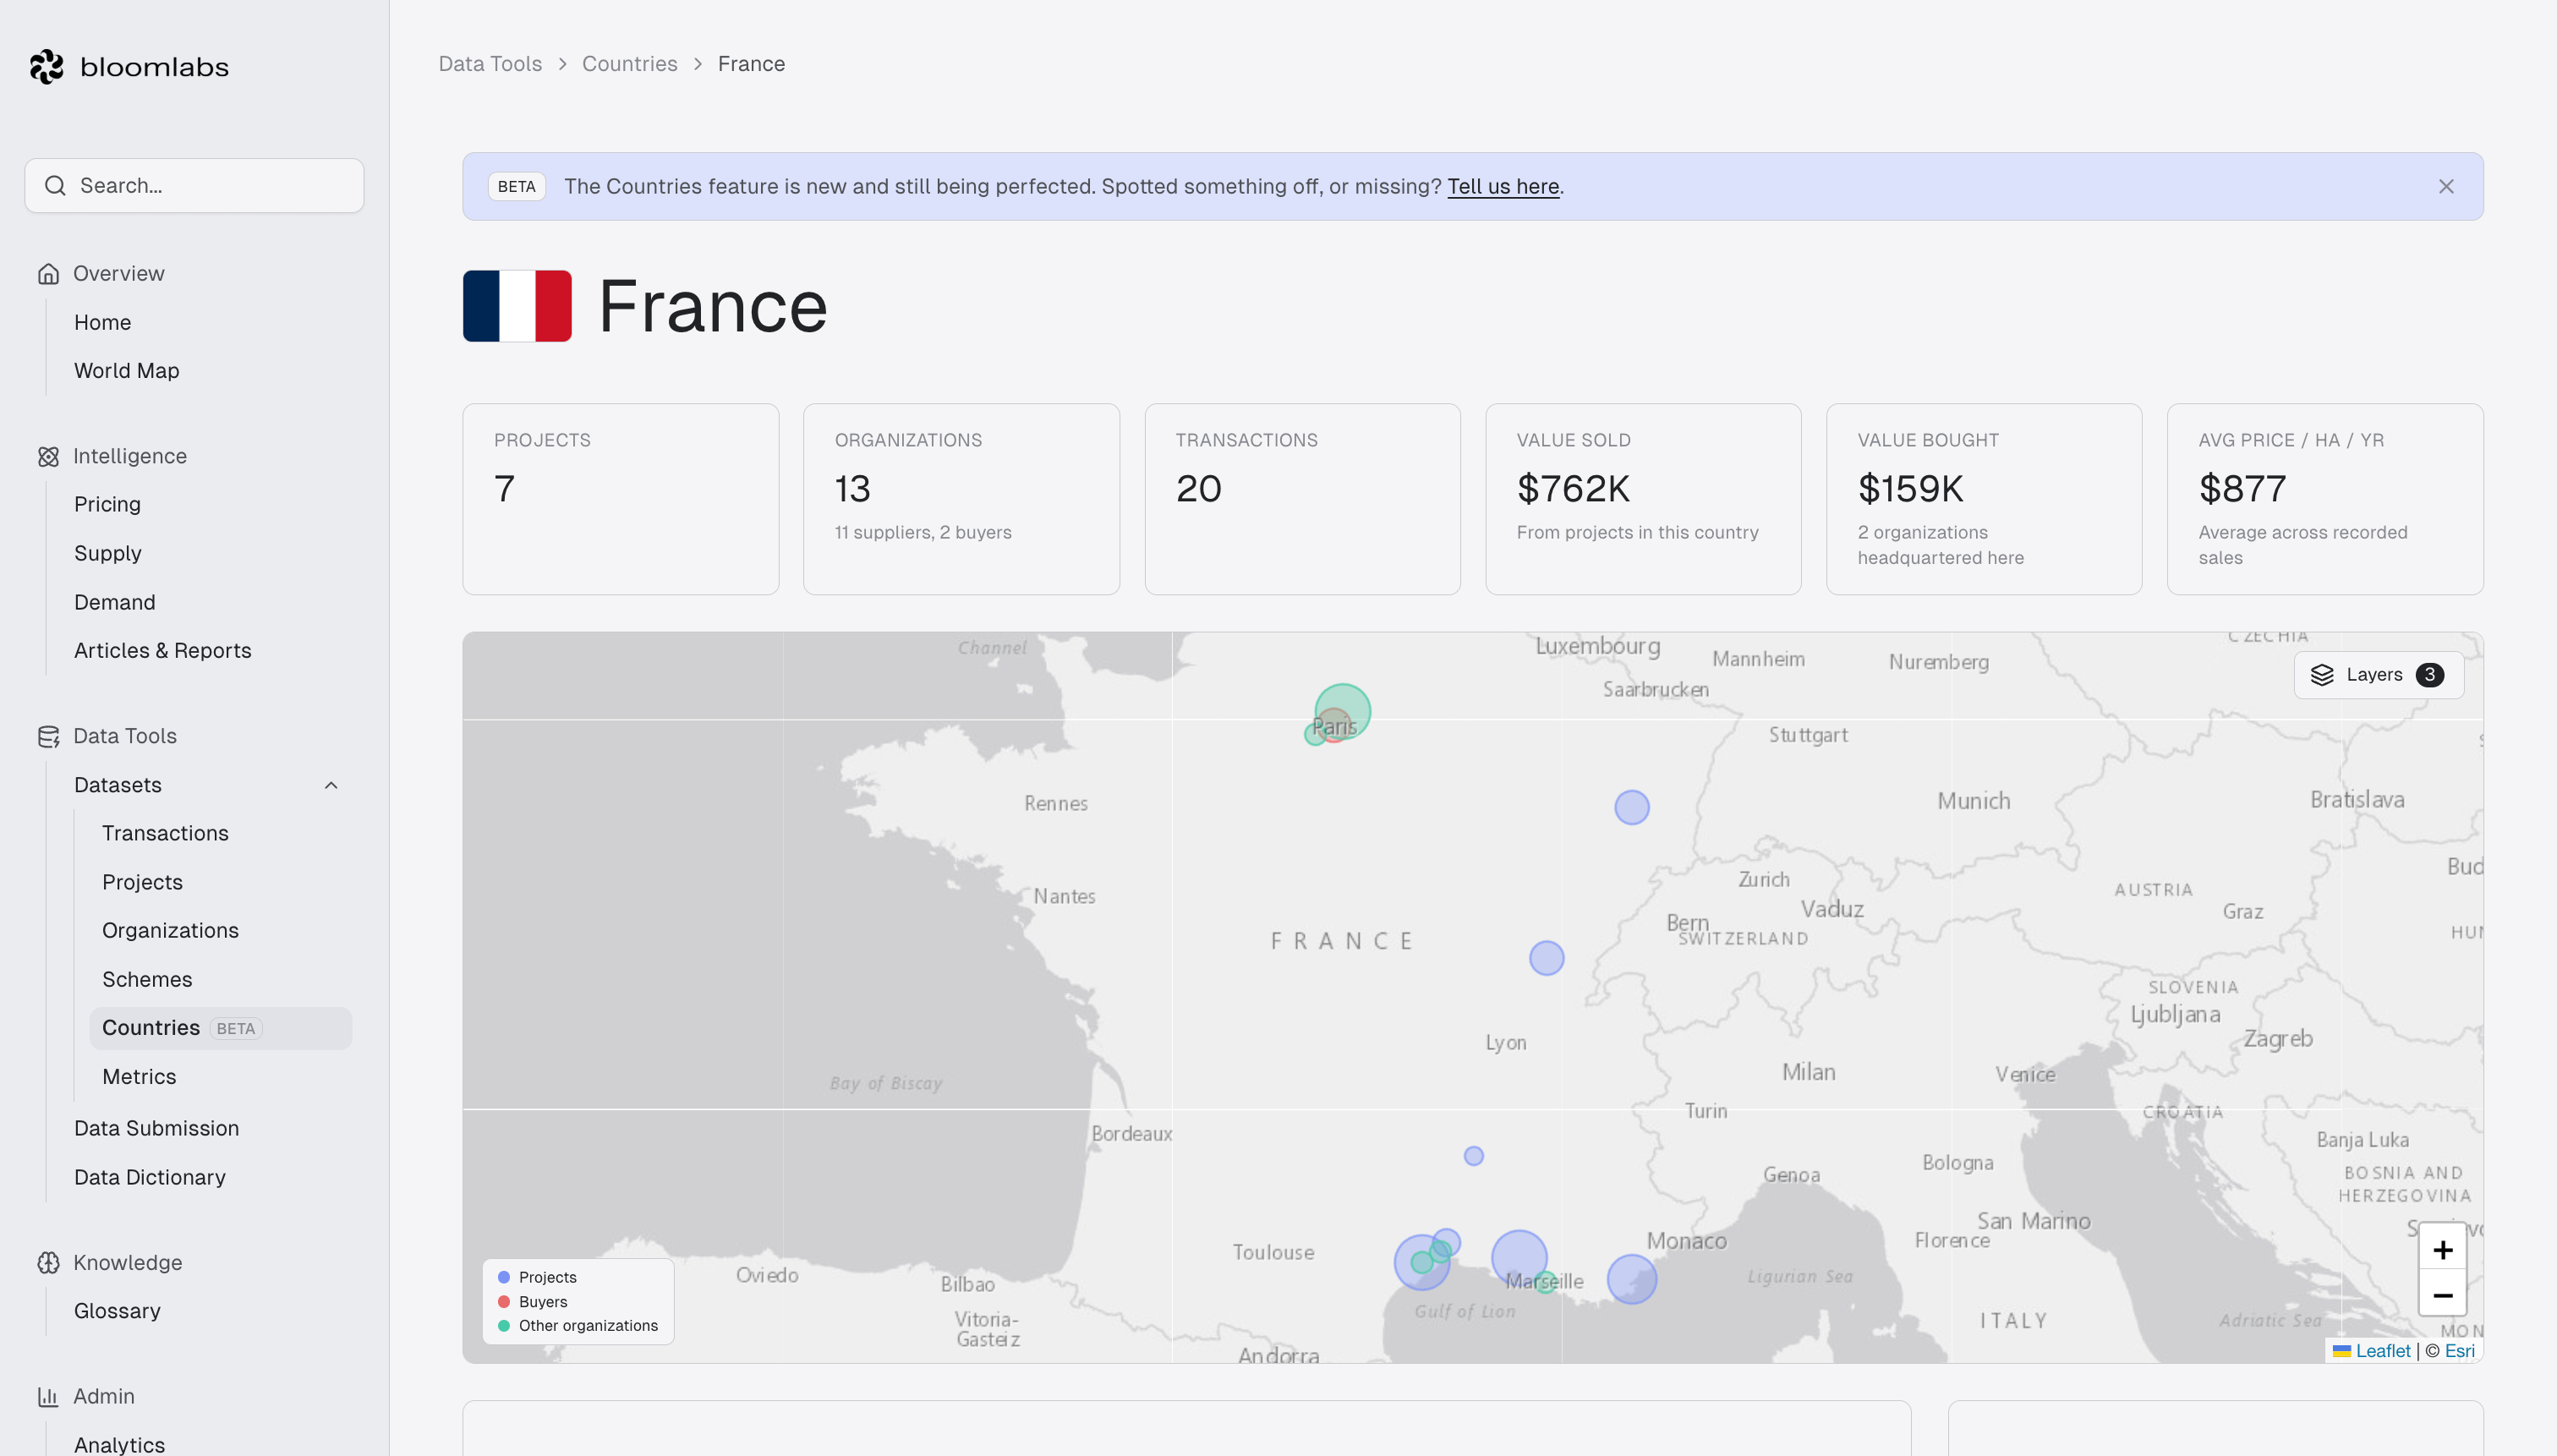
Project developers can understand, before committing to a given region, whether it has intentions to double down on credits, whether demand is there, and whether it is driven by compliance or voluntary intent. Buyers can compare every voluntary market’s project inside a given country and choose which credit to buy based on real data.
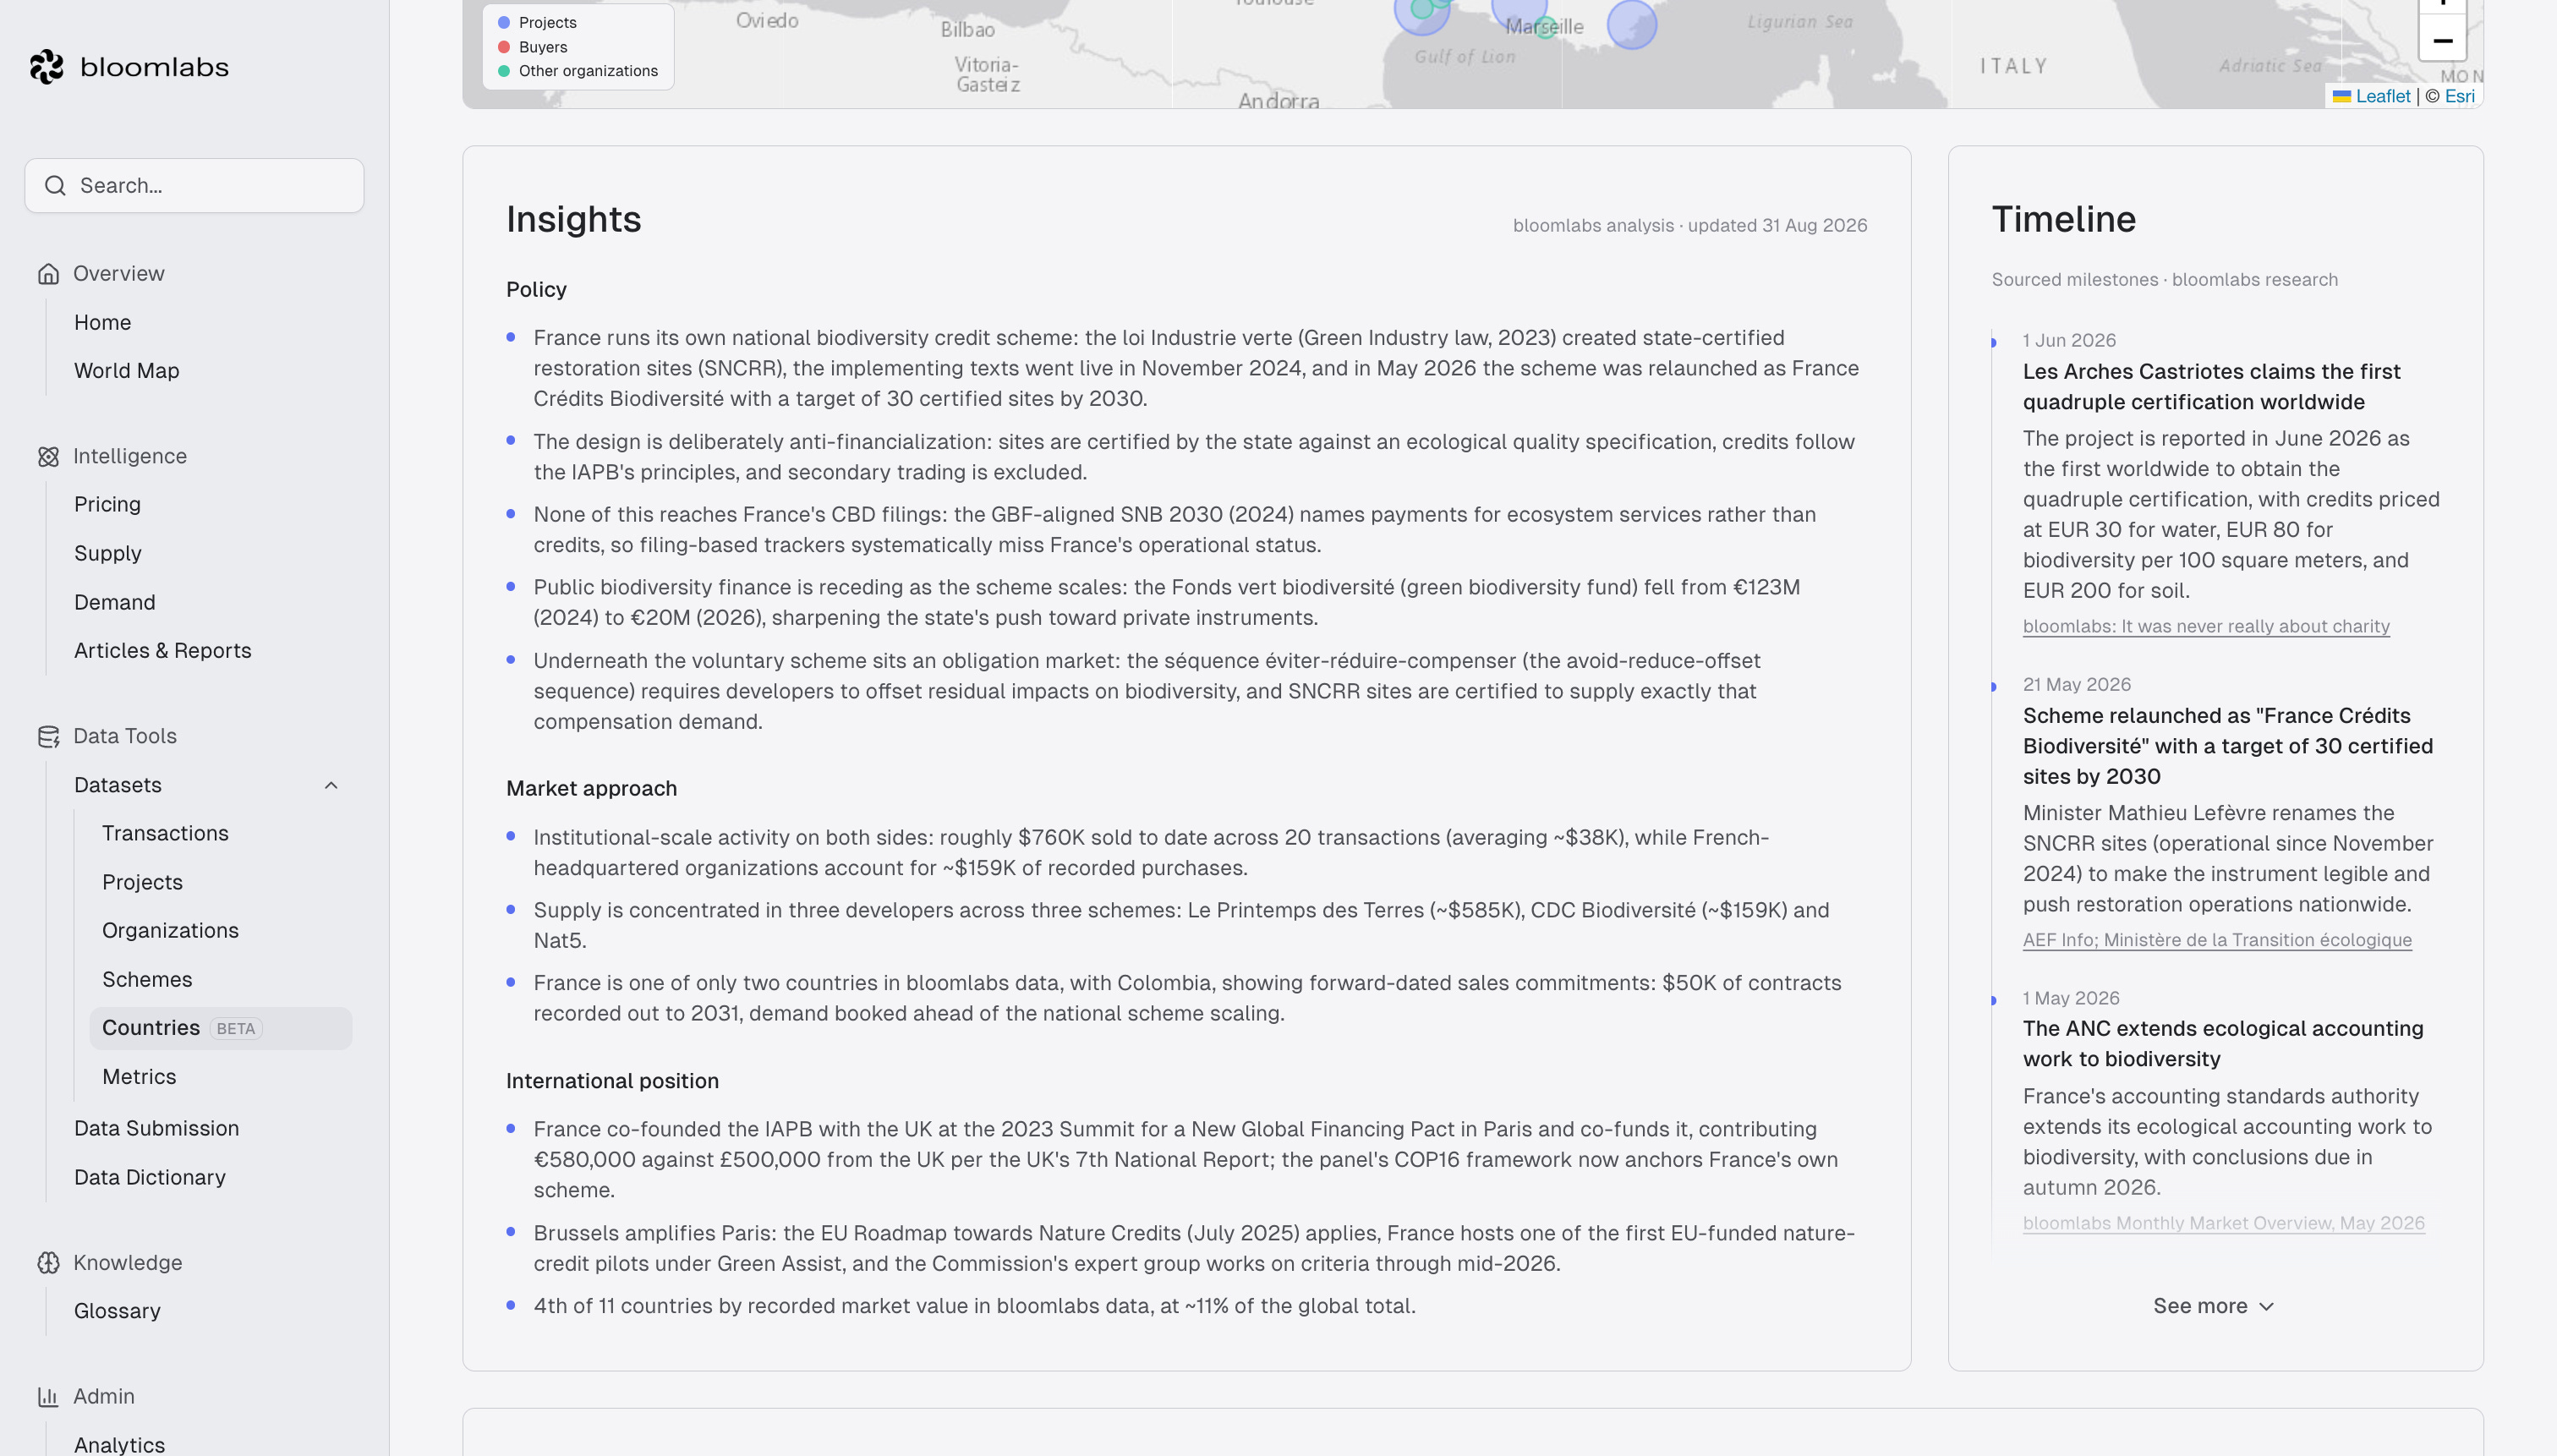
Investors and analysts can find opportunities from paradoxes between countries with no policy but market, and countries with no market but policy. Policymakers can look at what their peers in other countries have implemented, and how it could be relevant to their own.
As of today, we host 94 countries (plus the EU) in this new dataset. A country is included if it has named credits in CBD filings, or has market activity in Bloom (a project, an organization, a transaction, etc…), or if it has launched a credit-related initiative and showed intent. Among those 94, 54 intentionally name biodiversity credits in their CBD filings. On the ladder, 7 are operational, 1 is piloting, 19 are exploring, and 31 are only referencing credits. We also deliberately filtered out all the countries that mention biodiversity credits but do not yet do so with intent to explore or participate in the markets.
Hence, this dataset is a collection of every country where something is happening regarding biodiversity credits. Some of them only have an organization registered, like Namibia, while others lead on the international stage, like Australia. But this is exactly the point: to give the full picture.
What does it already tell us
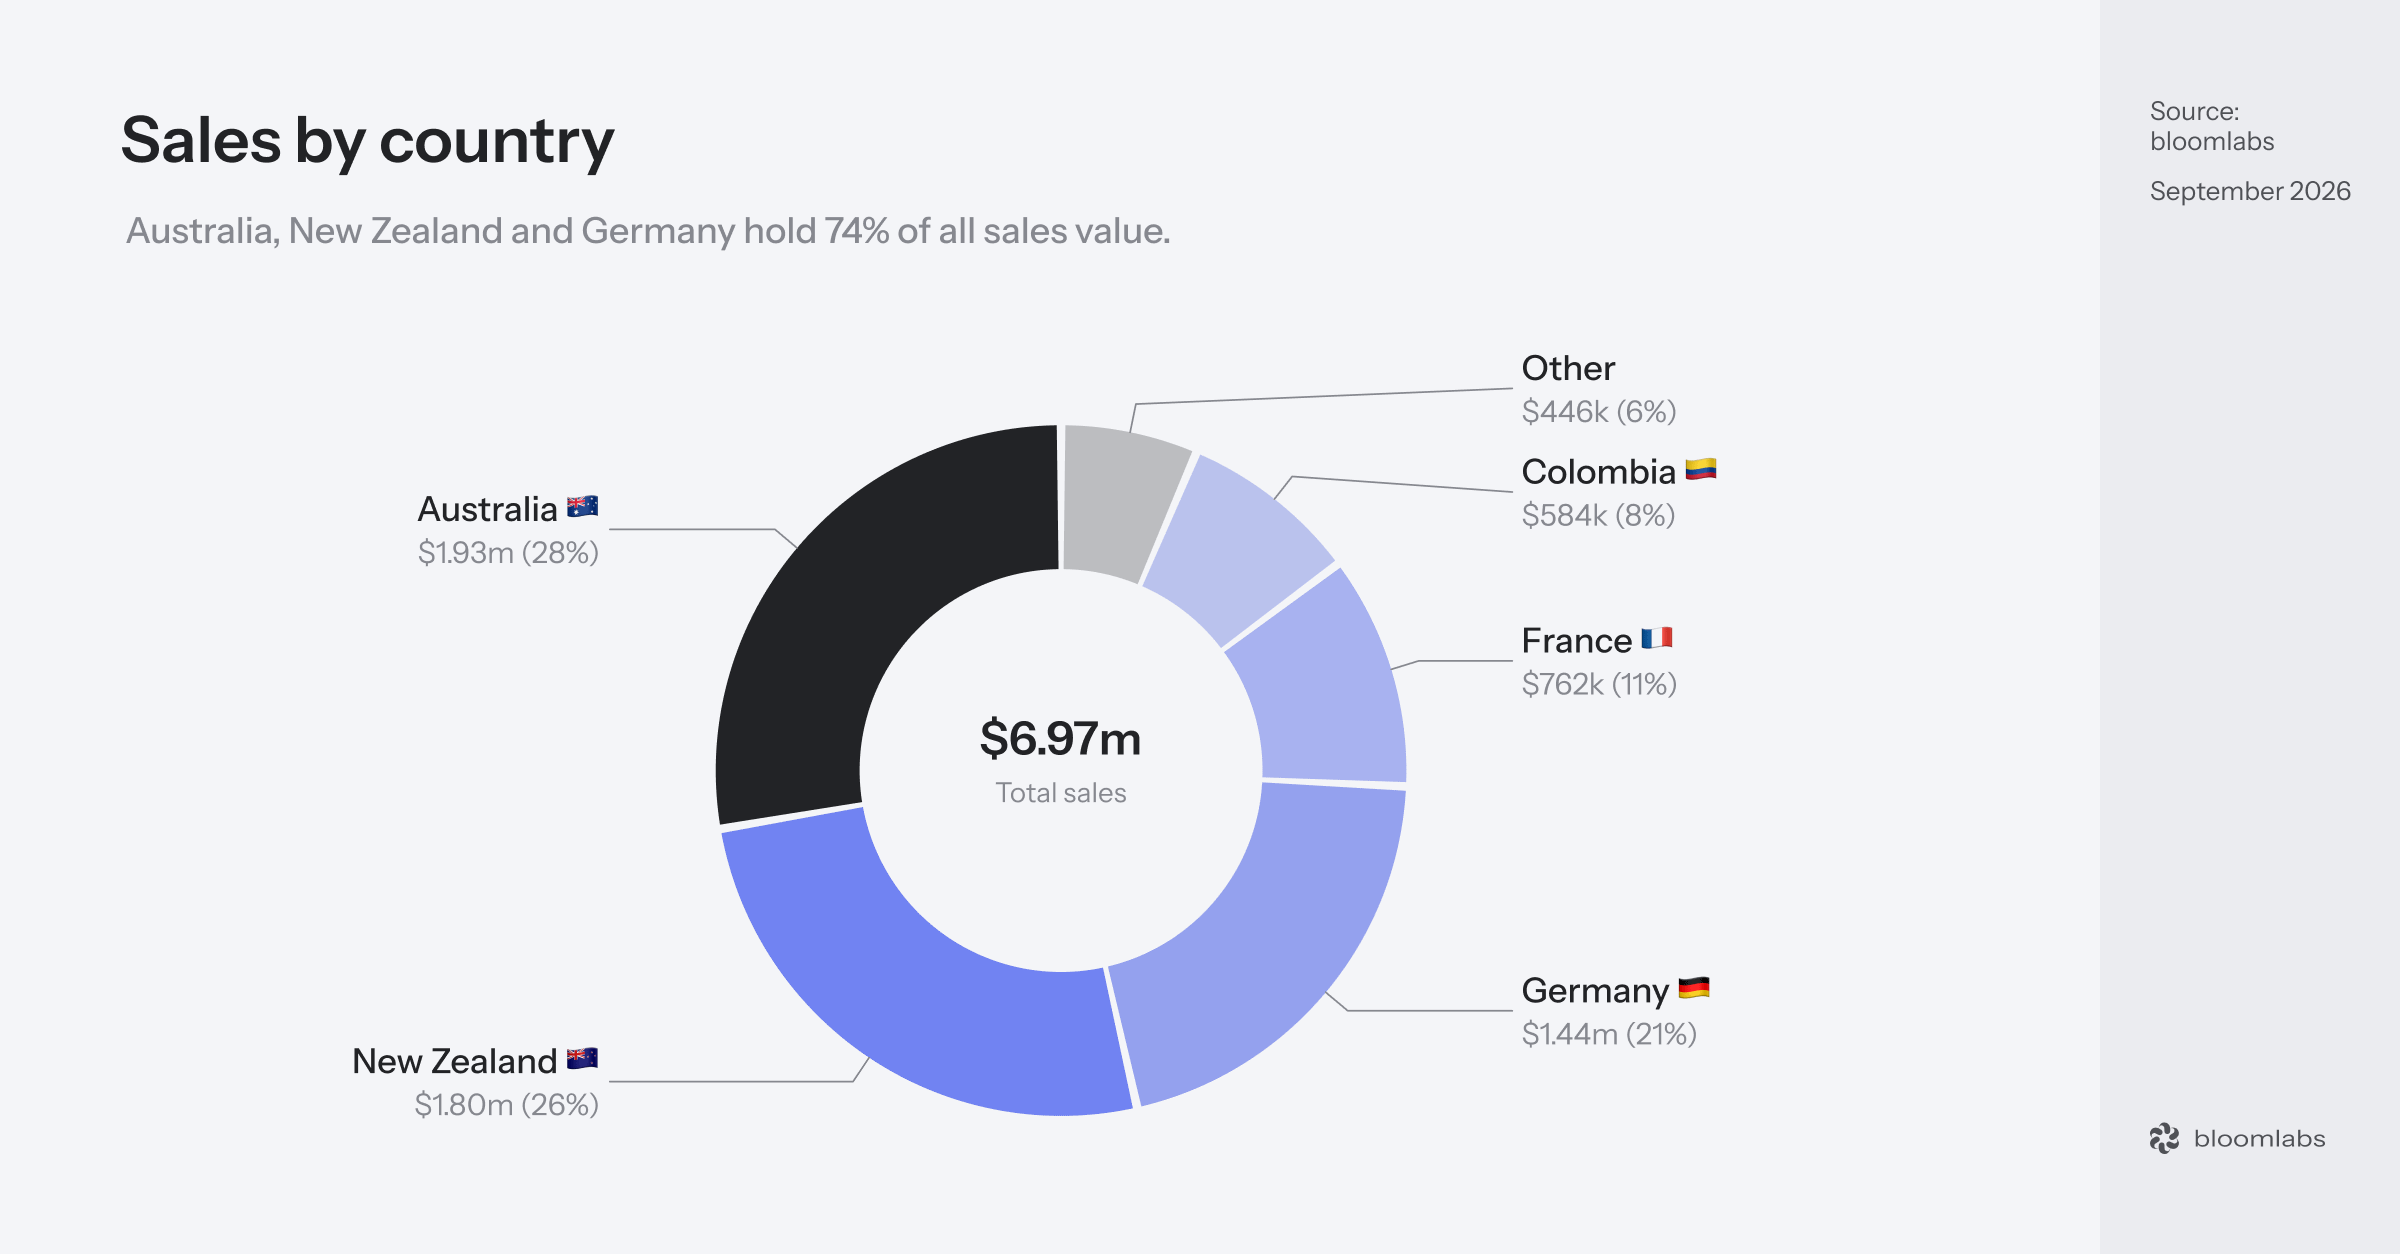
Sales today are highly concentrated in a handful of countries. Oceania generates more than half of the entire volumes of credits sold. Adding Germany, France, and Colombia makes the total climb to 94% of all sales ever recorded, mainly thanks to the established environmental markets they have implemented domestically. Each one of those 5 countries is not a diversified market in its own right either, since they all respectively have a single supplier moving mountains: Wilderlands, Ekos, green account, Le Printemps des Terres, and Terrasos.
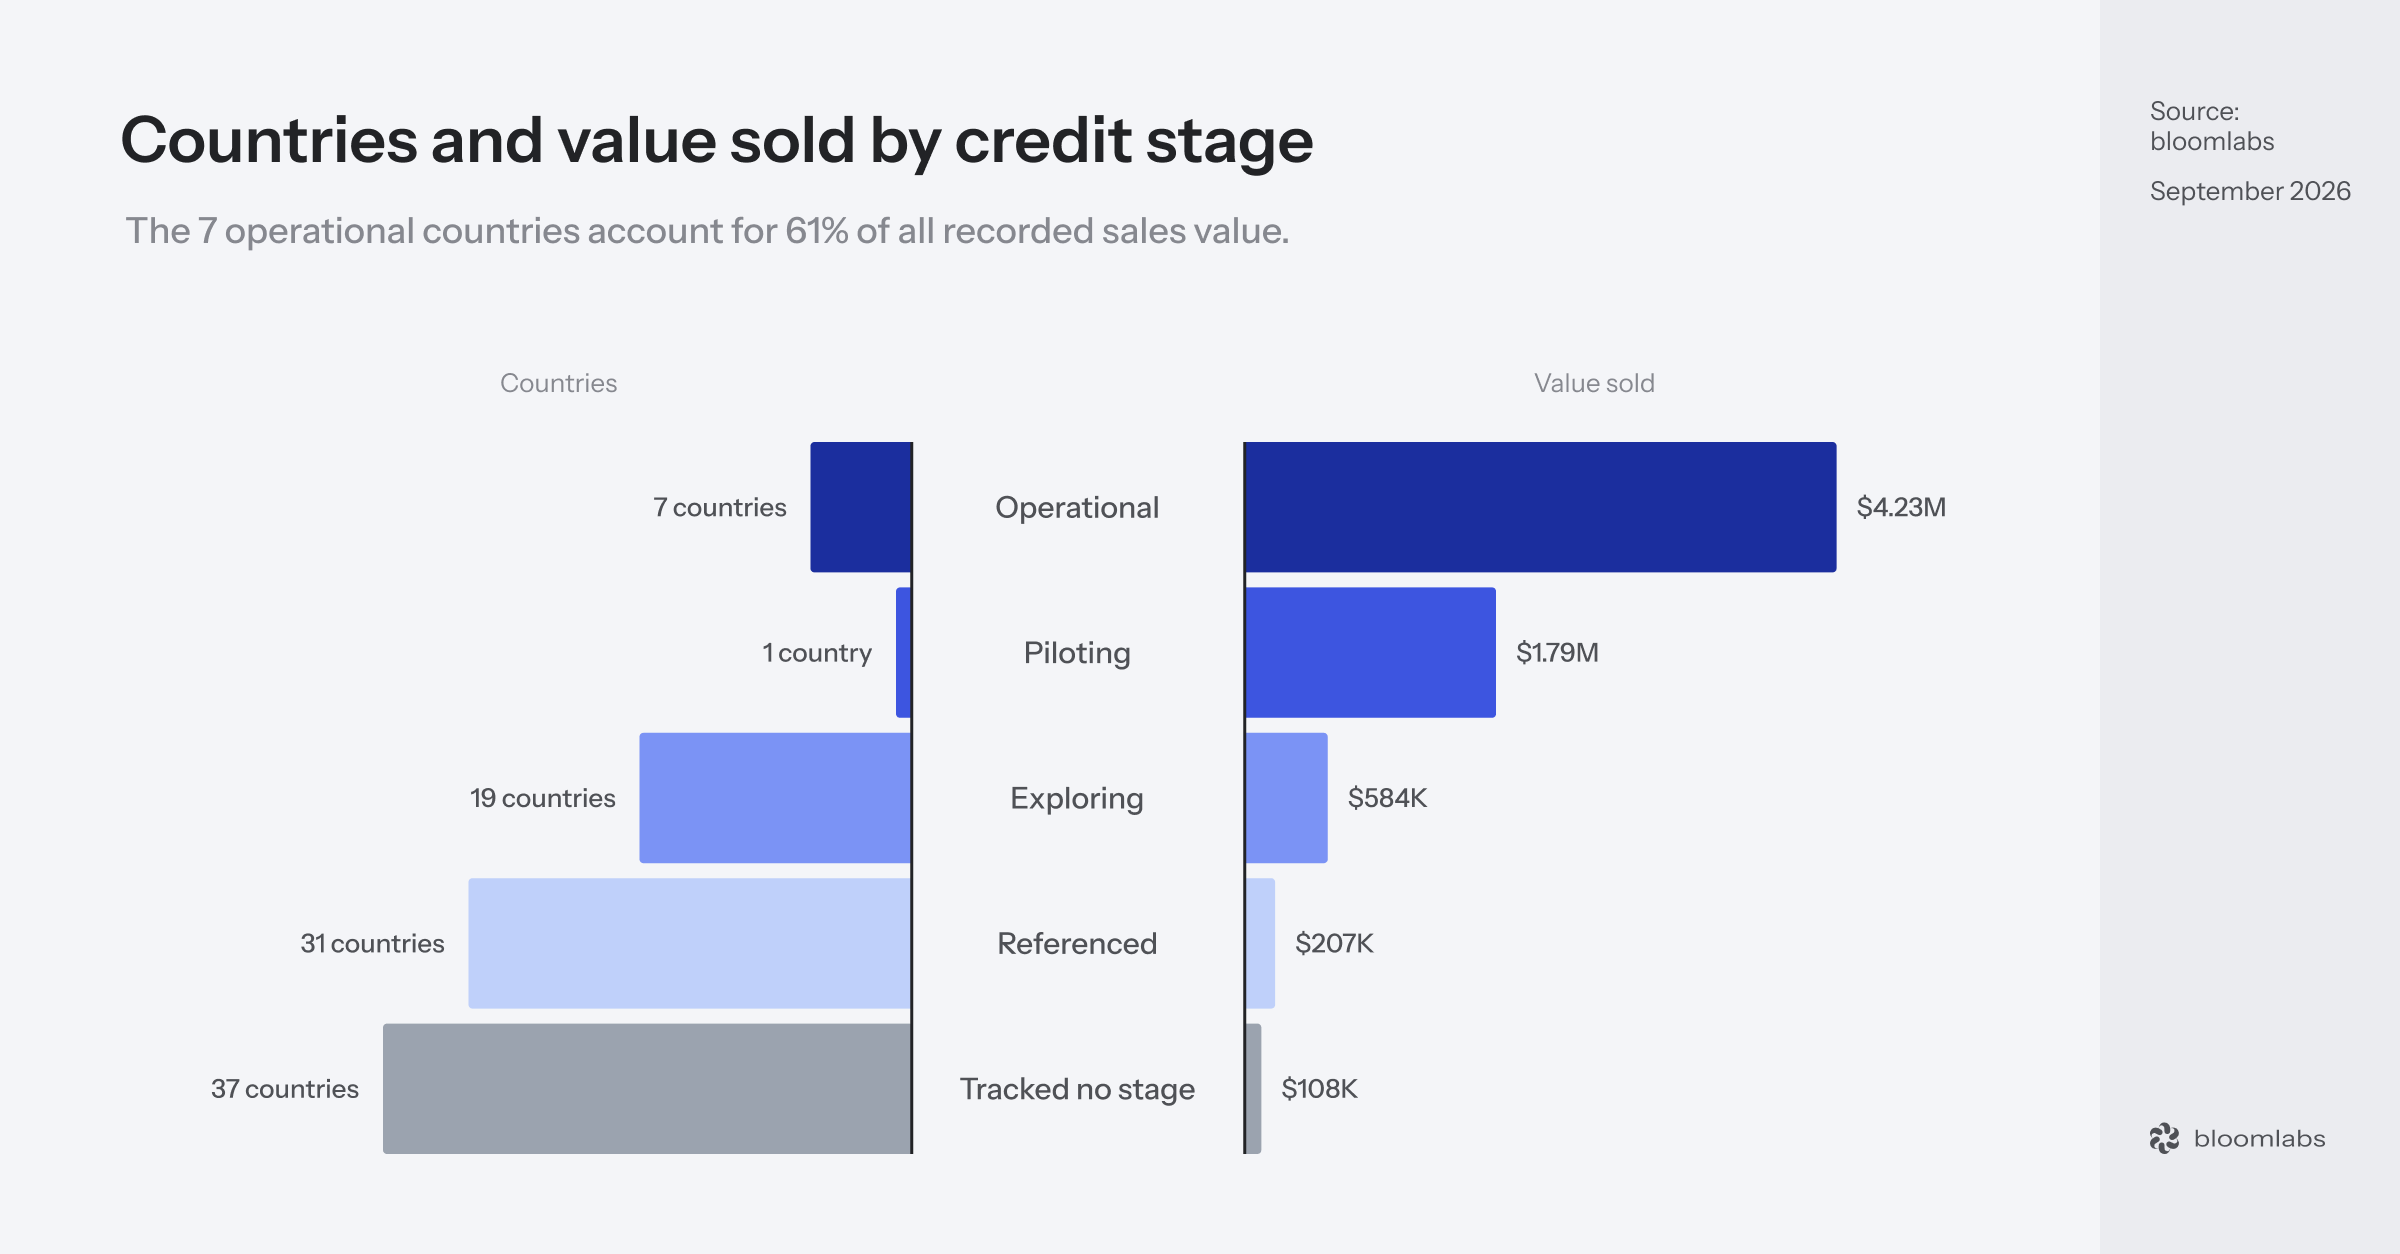
Market activity clearly correlates with position on the ladder. While we do not have structured proof, we do see a trend where policy usually attracts market activity, as it acts as a de-risking signal to buyers. Operational countries (7) average $600k in sales, more than 12 times what countries at earlier stages (51) achieve.
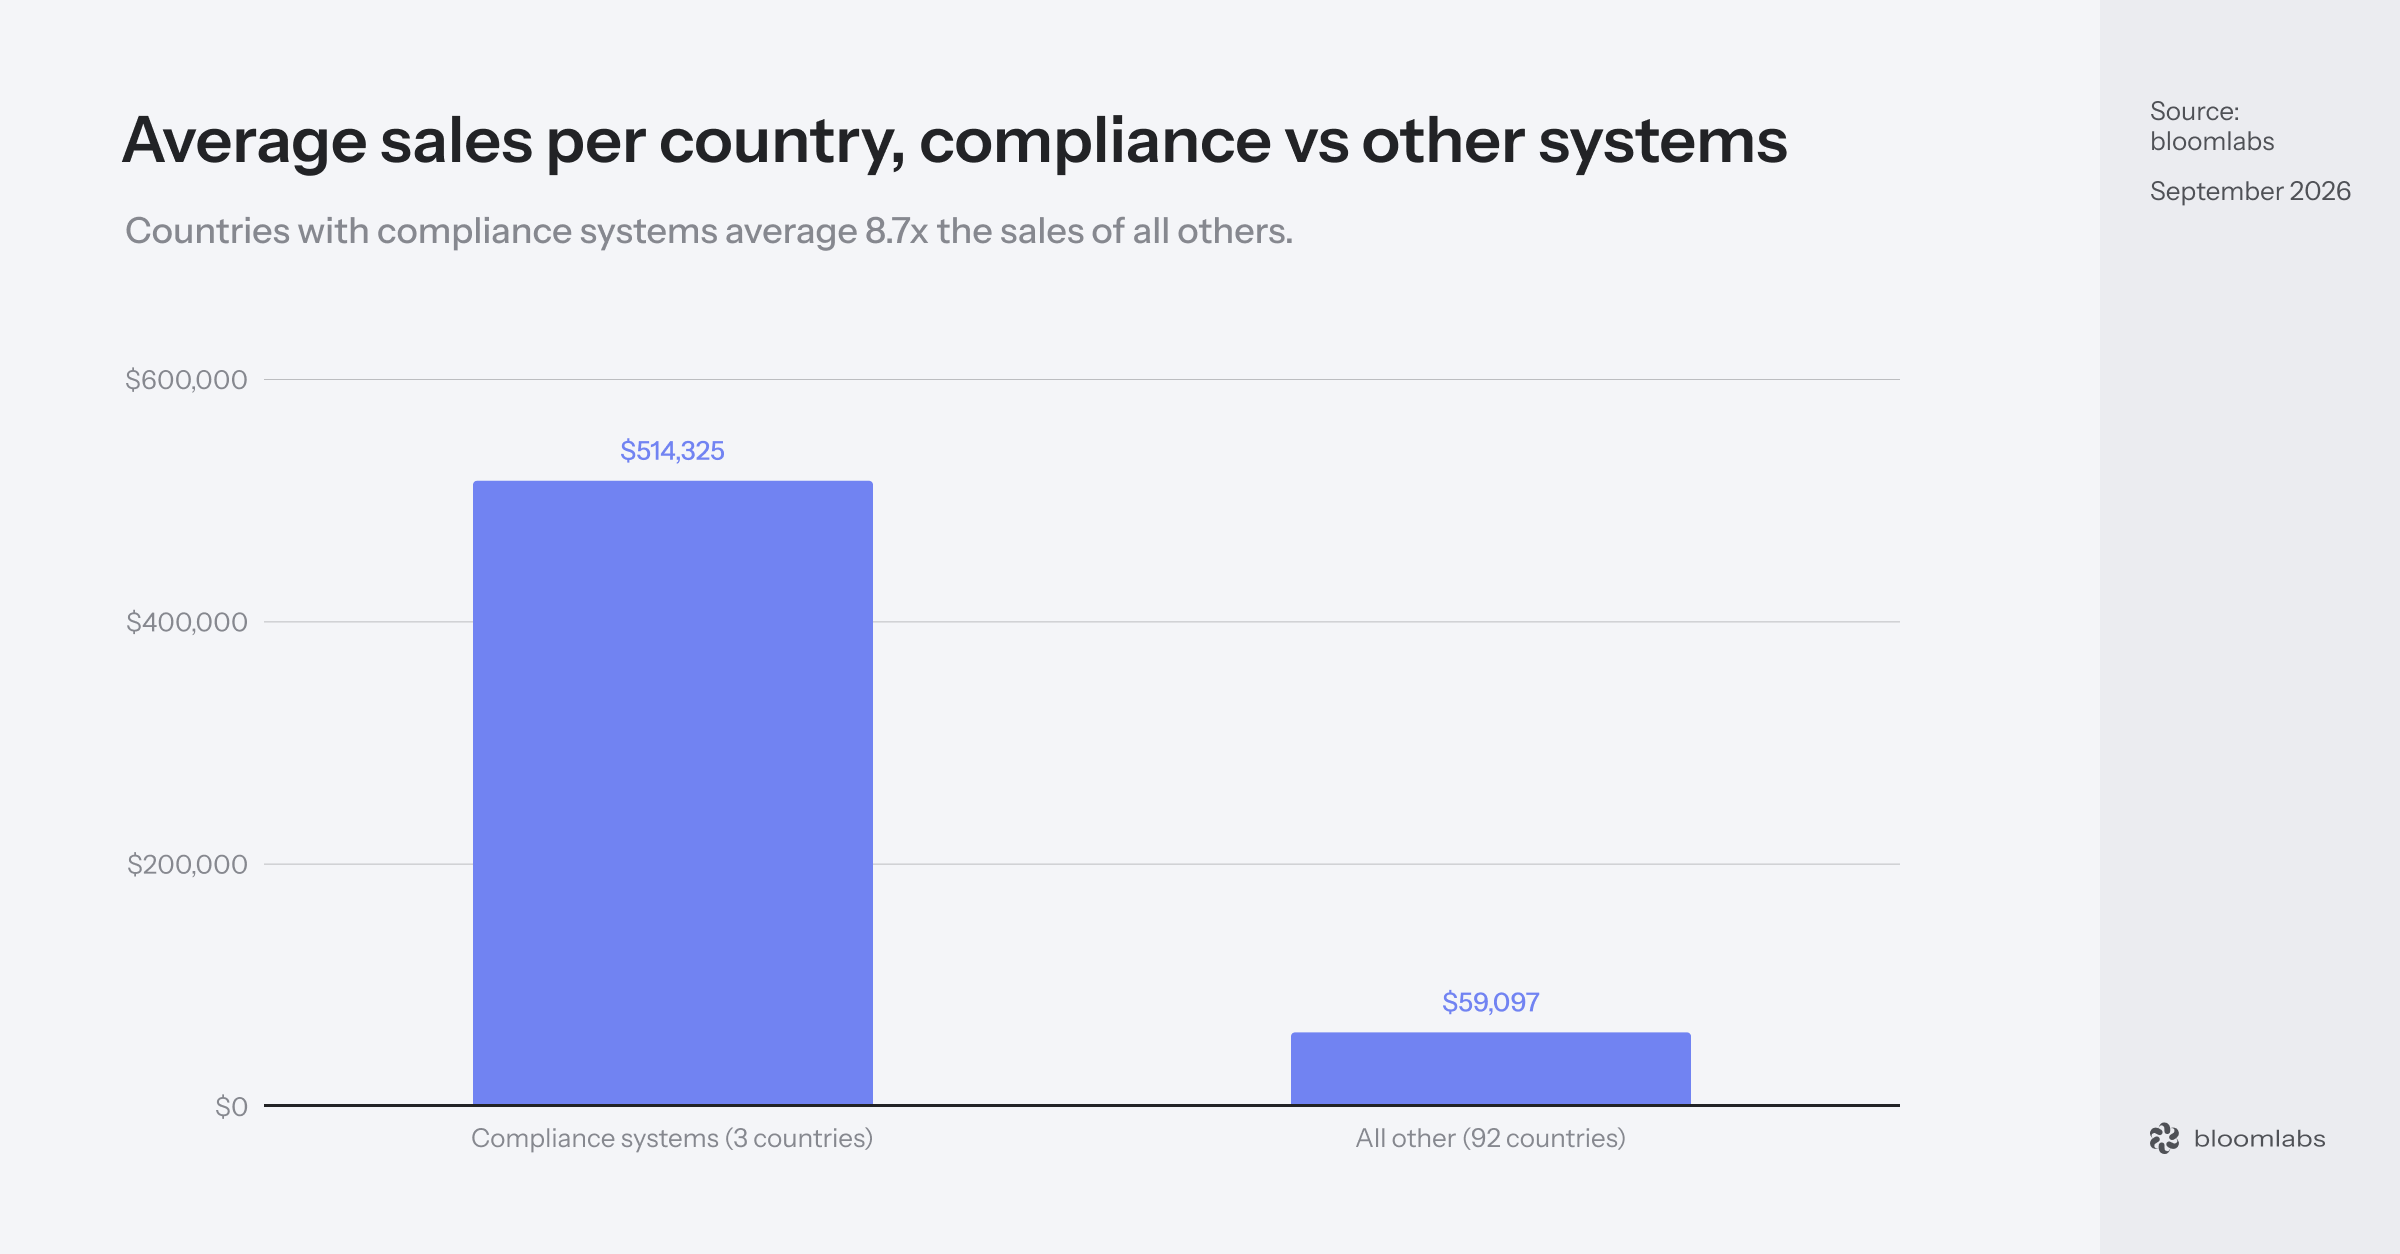
We have long argued that compliance systems can boost voluntary demand, and we can now start to back it up with numbers. Between countries with compliance (3) and all the other countries in our dataset (92), there is close to a nine-fold difference in average sales. Again, correlation is not causation, and the compliance group is small, with only Germany making significant sales. But it gives us a fair backing for a fair assumption that biodiversity credits have potential, even as voluntary mechanisms, if they are supported by regulation.
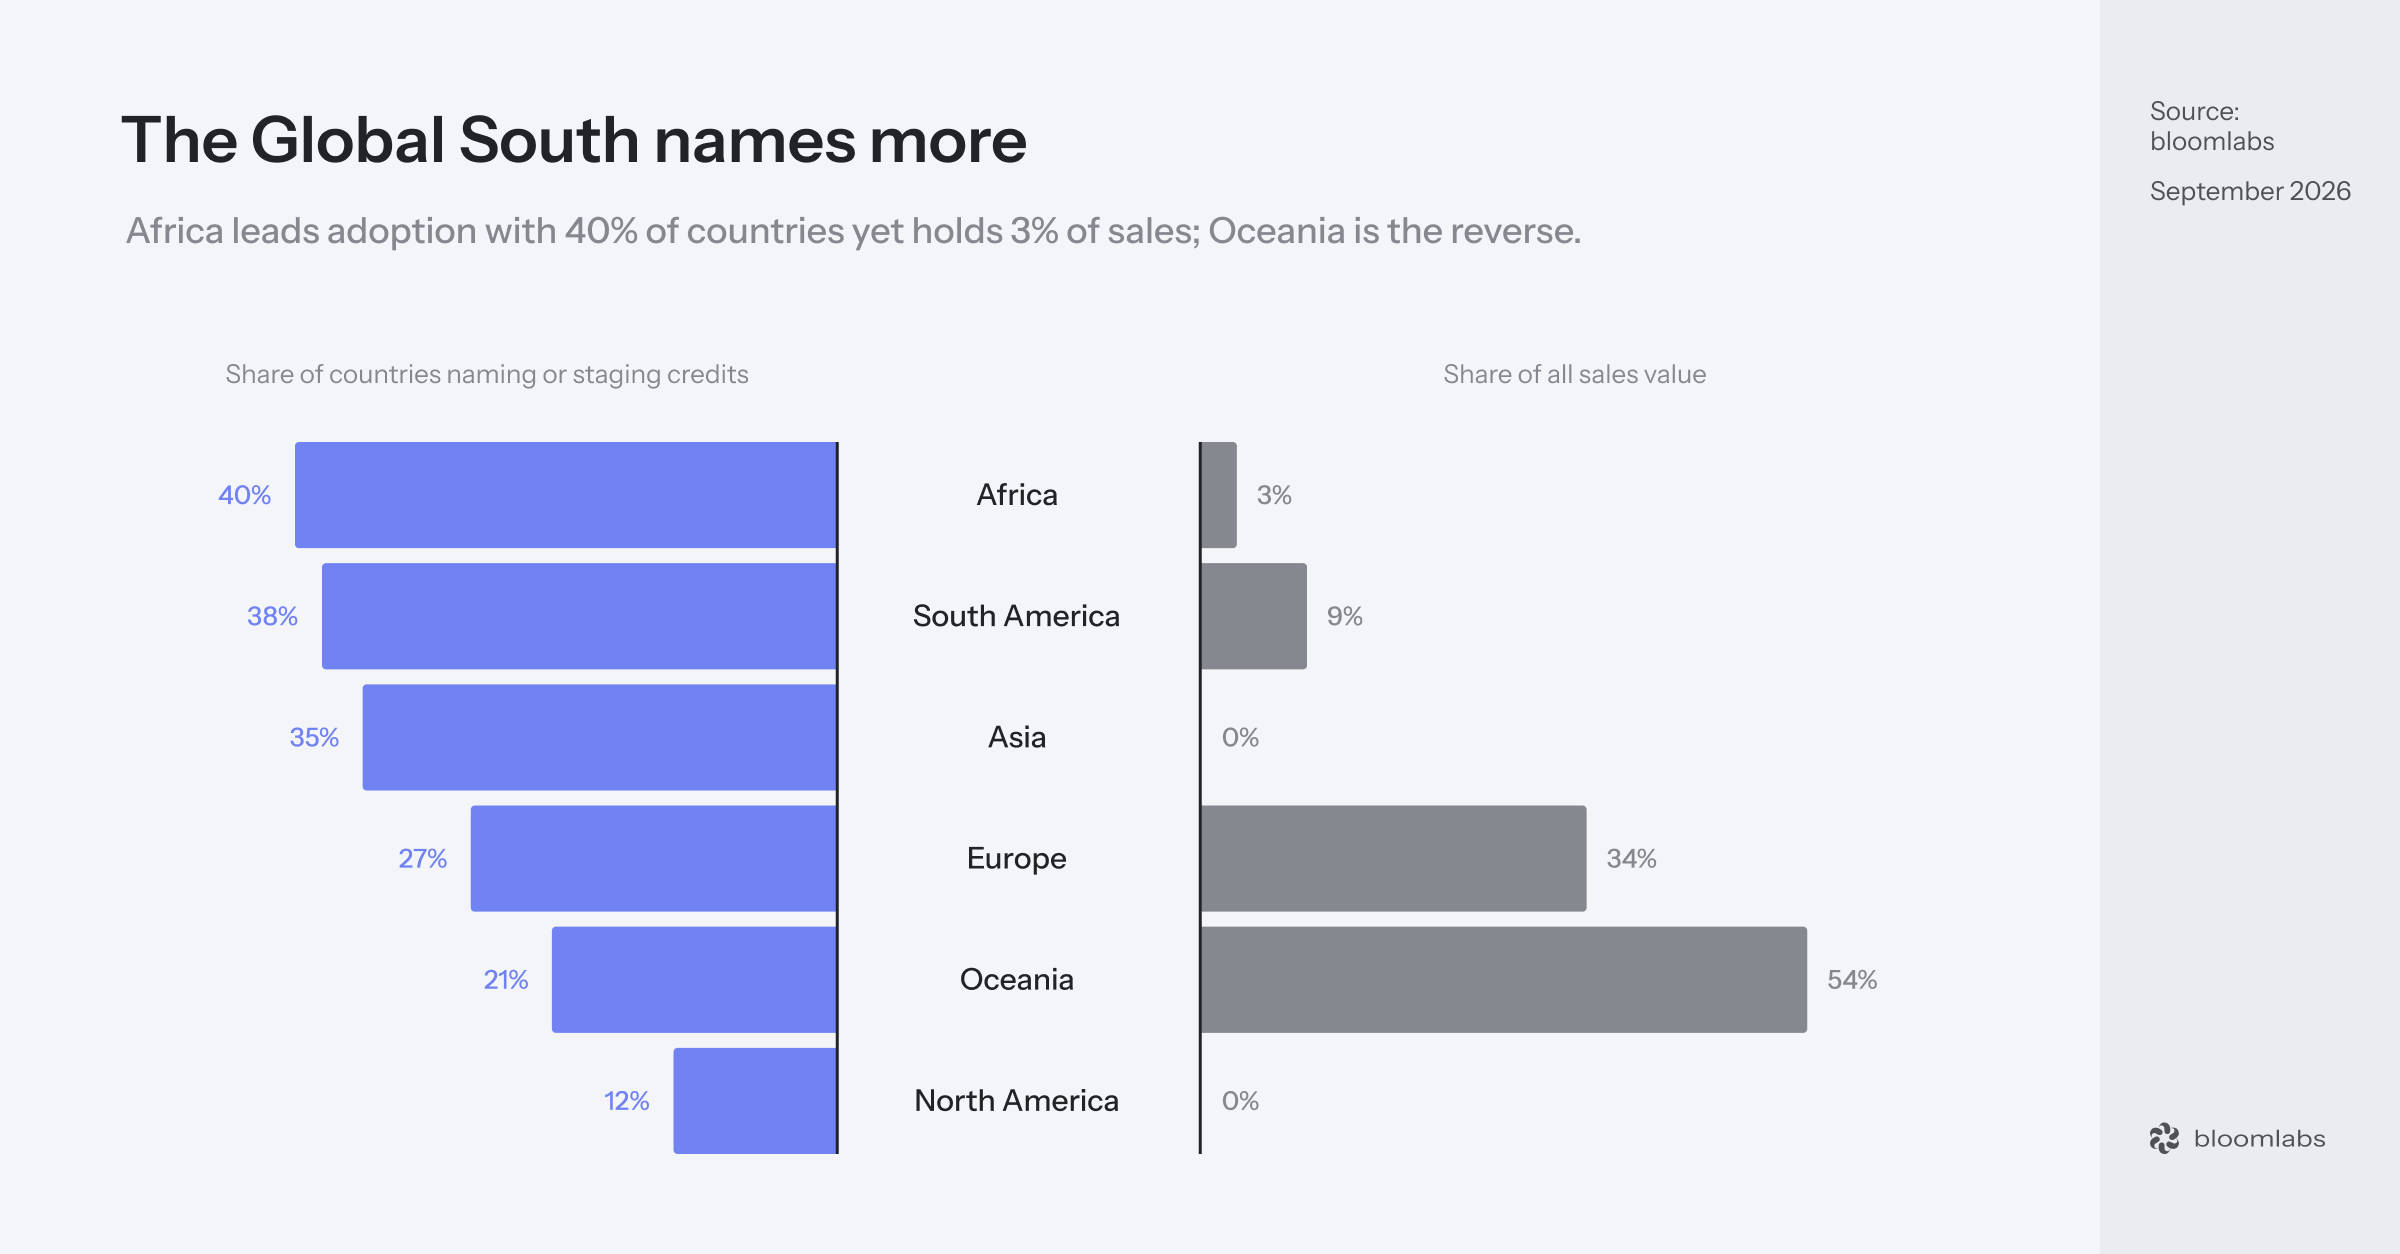
The concept of “supply regions” that we already mentioned in previous articles is showing explicitly when charting the share of countries naming credits or being on the stage ladder per region. Africa, South America and Asia all have adoption rates between 35% and 40%, while Europe, Oceania and North America get closer to 20%. It seems that the developing countries are incited to mention as much financing mechanisms as possible and hence signal ambition to donors, while high-income countries often already have national budgets to fund nature restoration and conservation.
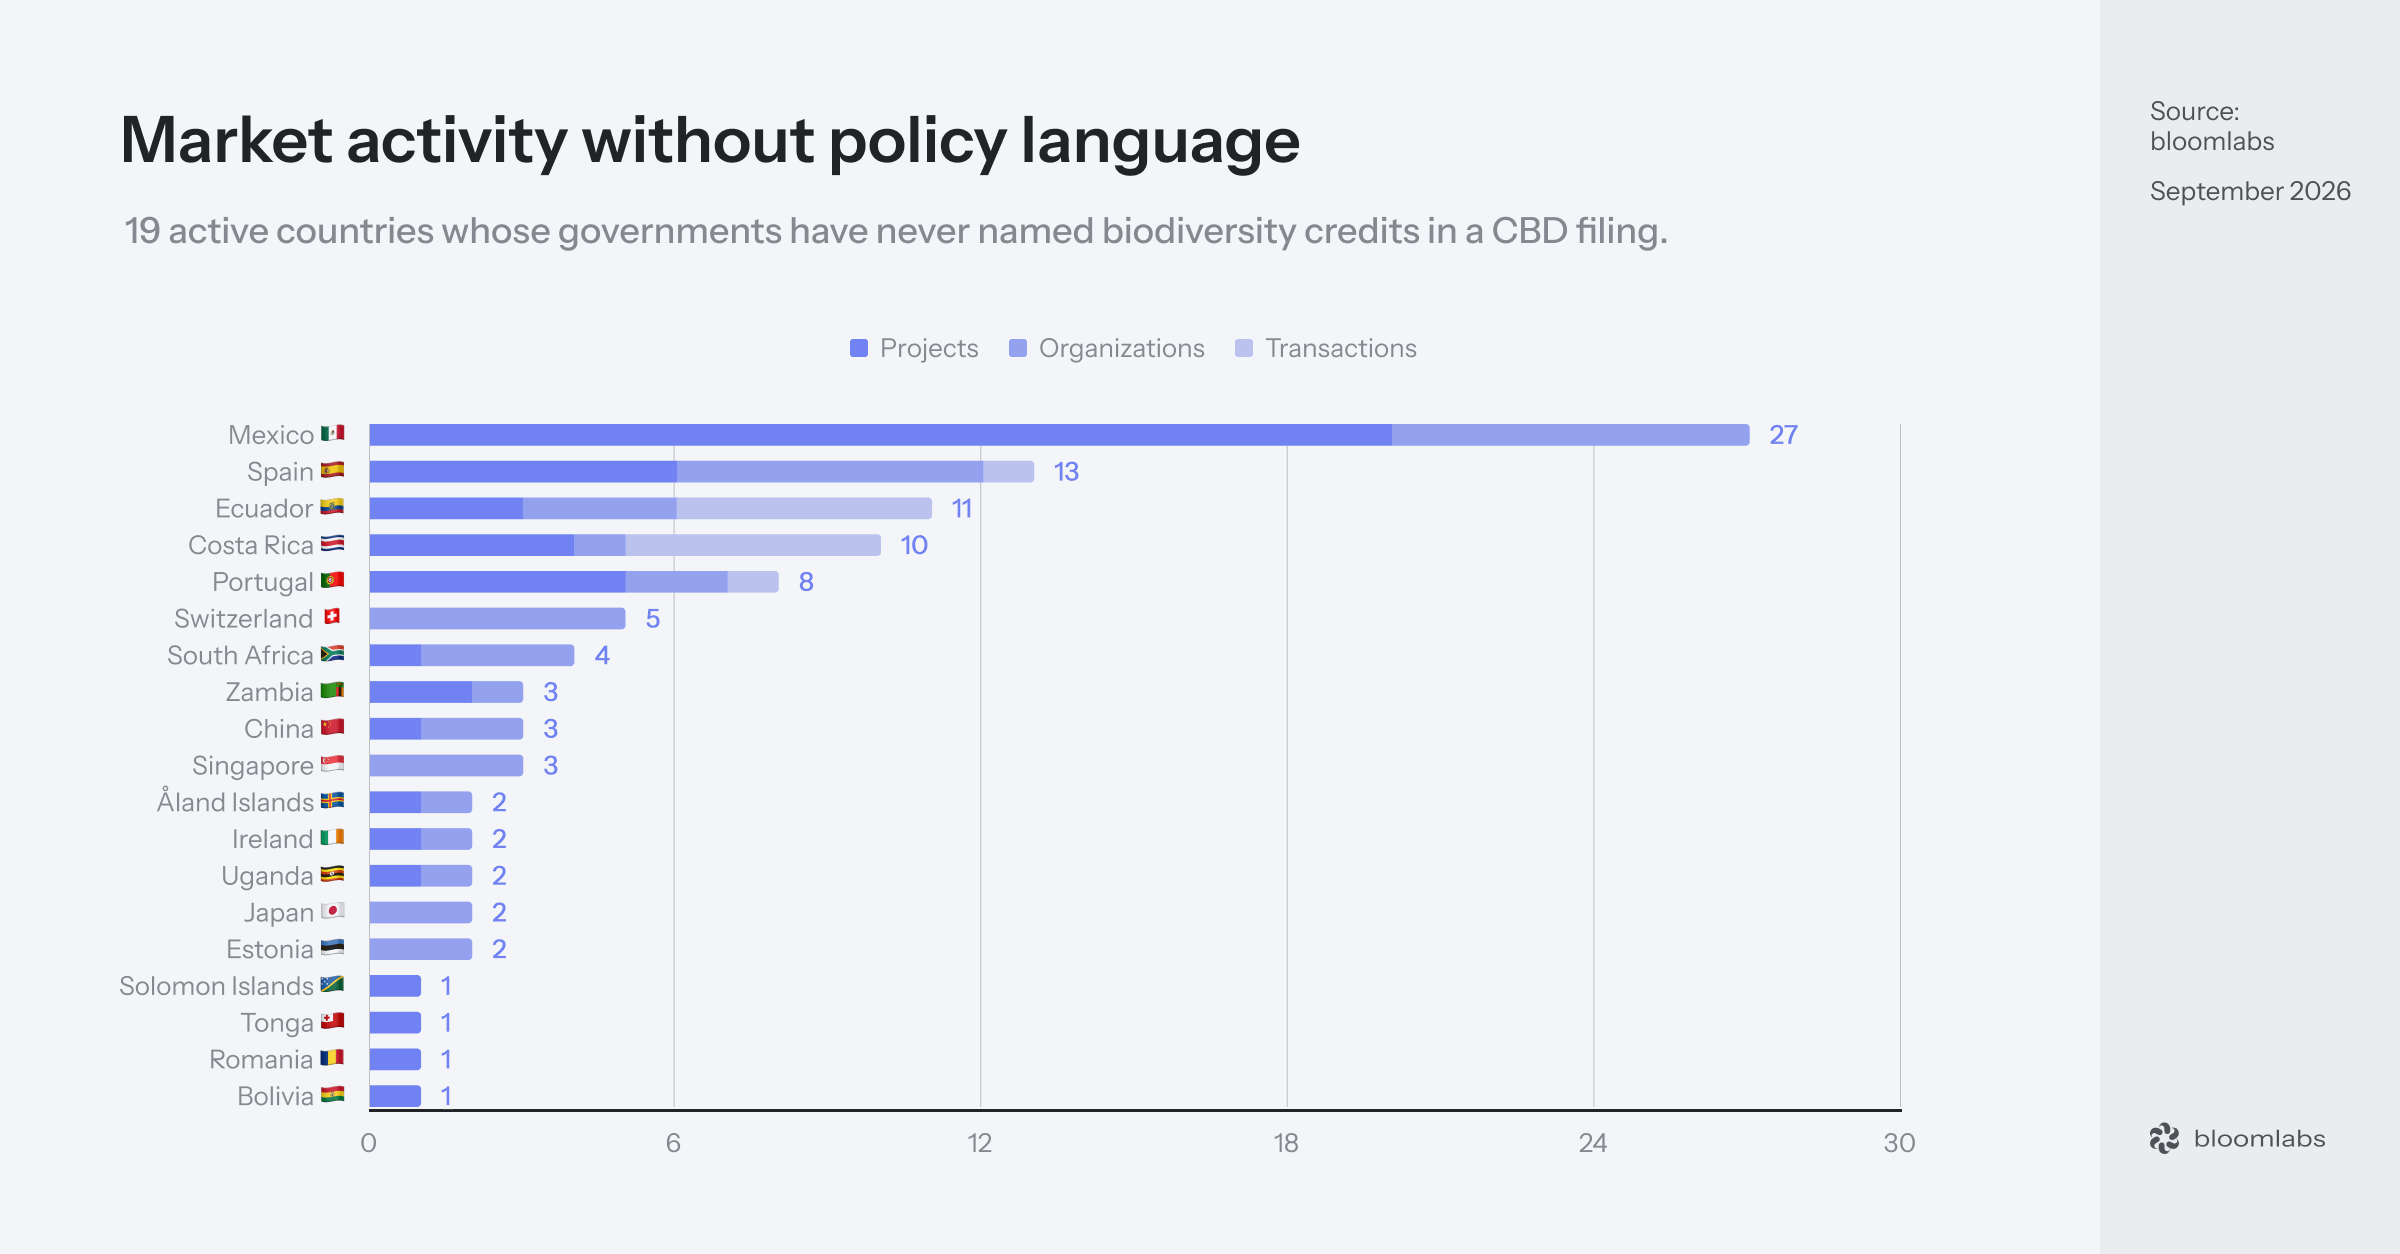
Even with this in mind, we observe a significant number of countries having market activity but no mention of credits in their filings. Even though not surprising for small countries with relatively little activity like Tonga or the Solomon Islands, one could question the LATAM positions (Mexico, Ecuador, Costa Rica) given the region’s activity as a whole, especially with Colombia - a pioneer of the mechanism - being right next door. Spain and Portugal also feel out of place given the EU Nature Credit roadmap and their neighbors’ influence. A good reminder that credits are not a universally accepted and recognized mechanism to date.
The time to align is now
There is a reason we are launching the Countries dataset now. Since the Global Biodiversity Framework in 2022, we have seen an explosion in the interest in biodiversity credits - not only in the voluntary setting but also within national and regional legislation. We do not know the exact number of countries that have publicly referred to biodiversity (or nature) credits before 2022 but it was definitely nowhere close to the number now - more than 50.
As (inter)national nature conservation commitment deadlines loom closer, pressure to implement biodiversity credit systems successfully is increasing. The European Union, in particular, has taken the matter at a bloc level with its Nature Credits Roadmap that will conclude in 2027 - the most important global development in the entire market. Biodiversity Credit Alliance and the International Advisory Panel on Biodiversity Credits are both drafting key guidance and standards that will also shape both the voluntary and compliance biodiversity credit markets.
The next 12-18 months is probably the most important period for biodiversity credits. There is an immense opportunity to avoid unnecessary fragmentation and create a set of functioning national systems that are interconnected. By the time these countries reach piloting and operational phases, it will be too late.
We hope this dataset is going to help countries “compare notes” and contribute to more alignment between each. You can check it out here - it is fully open for free for the first 2 weeks.
That said, the feature is still in Beta. Errors will likely surface in the first weeks while we continue to fine-tune the workflows. We are very open to any comments, suggestions, or criticism.
If you want to dive deeper inside some of these national and regional policies, feel free to reach out at hello@bloomlabs.earth.
Really insightful grounded data thank you
No Papua New Guinea?