
Voluntary Biodiversity Market Projects
Deep dive into the largest database of projects generating voluntary biodiversity credits.


Our Projects database closes the last major gap in Bloom. We knew who was involved in the market, which schemes were used, the transactions that occurred, and which metrics prevailed. Now, finally, we connect everything with the most extensive aggregation of project data for the voluntary biodiversity credit market.
Disclaimer
This is not, at least yet, an exhaustive list of all the projects in the space. We aim for maximum data accuracy, but we cannot guarantee that 100% of the data points are correct. As we seek objectivity, we do not maintain preferential relationships with any organization mentioned.
Our Projects data is sourced from public registries, direct data collection from developers, data partnership agreements, and curated research. We aggregate, verify, and standardize our data points through a human-led, multi-layered quality assurance process. We have not used any web scraping tool or AI extraction system.
If you spot any errors or missing data, please send us a request via our data submission hub.
tl;dr
The biodiversity credit market is shifting from experimentation to early consolidation, with activity concentrating around a few mature countries, schemes, and developers: 10 countries host nearly 90% of all projects area and 89% of all credits issued.
Restoration projects dominate by project count (71% of the market), while preservation projects cover the largest land area. Both are essential for a credible, scalable market.
The cost per hectare per year of a given credit sits at around $3,100. Removing two extreme values gives a more realistic average at $980.
A handful of players drive the market. rePLANET (project count), FRONTERRA (project size) and Wilderlands (credits issued) are leading the developer pack.
Strong early concentration in large-scale initiatives is emerging: the 10 largest projects cover 75% of the total hectares.
Projects under the top 10 schemes make up 95% of the total project size in the market, confirming that market activity is currently centralized.
Average credit prices hover at around $230. Weighing by credit volume makes this average fall to $27, a more realistic value when answering “how much does a credit costs in today’s market?”.
More than 25% of projects reported stacking biodiversity with carbon.
Now, let’s jump in.
This analysis is powered by Bloom, our market intelligence platform. Visit it here.
Global overview
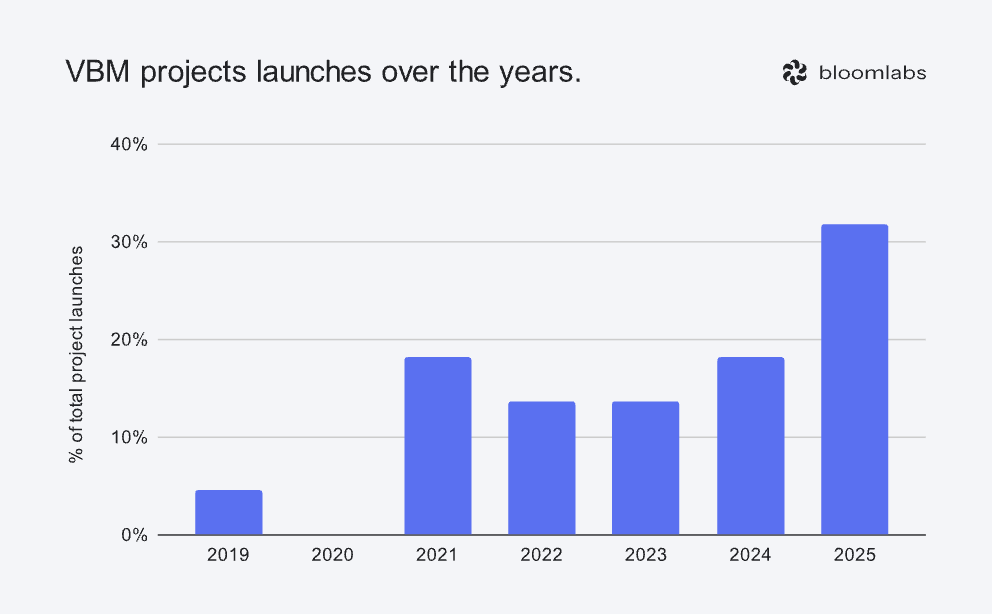
Our database aggregates 134 projects as of October 29th, 2025. There have been 7 times as many projects starting in 2025 as in 2019 - a steady increase, mainly due to the 2022 kickstart of the GBF agreement. GreenCollar’s 7 projects in Australia are responsible for the 2021 spike, thanks to the country’s early mover position in nature markets. A third of all identified projects have been launched in 2025.
The total hectares under management amount to more than 2.5 million, while 15 million credits have been - or are planned to be - issued. By status, nearly 22% of projects have issued - or are in the process of issuing - credits, about 31% are officially approved by the credit scheme and eligible for issuance, 31% are under the validation process by the credit scheme, and 16% are still at the concept stage.
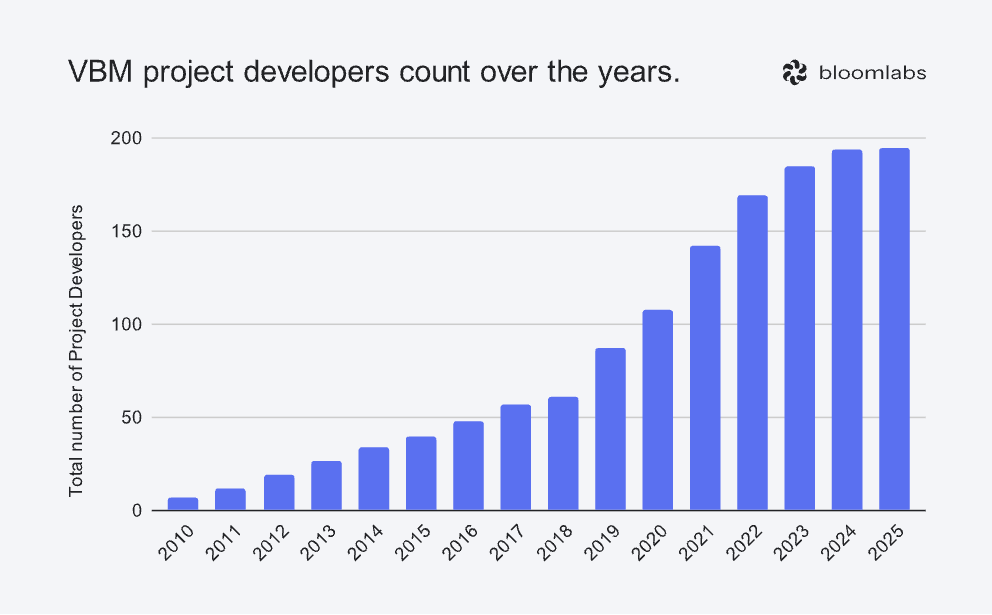
The market is experiencing a shift from a rapid surge of different initiatives to more stable consolidation. The growth in new project developers operating in or exploring the voluntary biodiversity market (VBM) is a good proxy for reflecting this trend. Most market stakeholders, including credit schemes, project developers, and service providers, have entered the market during the 2020-2024 growth phase. This phase can be partially attributed to the Kunming-Montreal Global Biodiversity Framework (GBF) agreement, signed by 196 nations in December 2022, with 23 targets, including protecting 30% of land and sea by 2030.
Geography
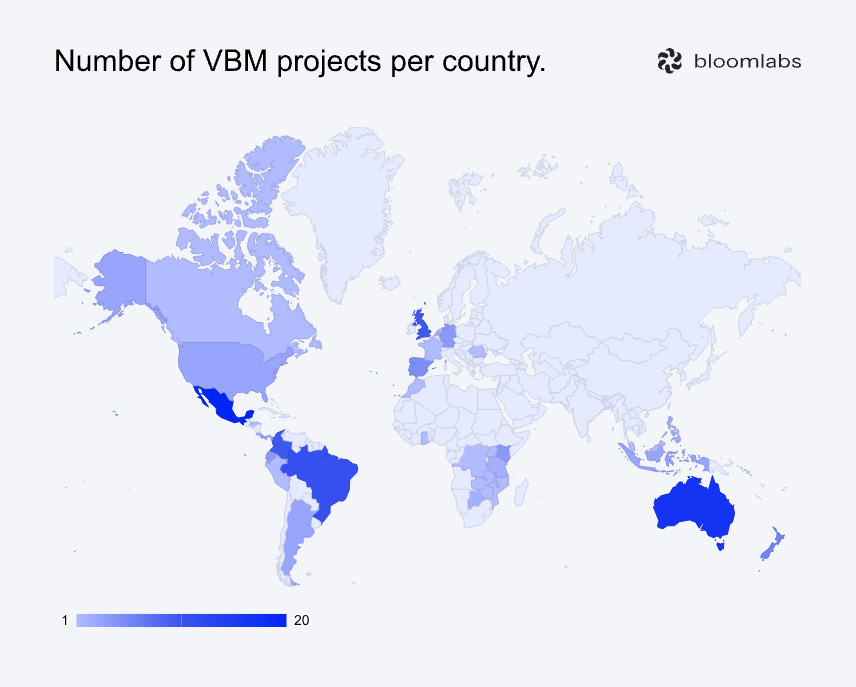
By project count, 5 countries host 51% of the total (Mexico, Australia, Brazil, the United Kingdom, and Colombia). Regionally, South America, North America, Oceania and Europe host more than 82% of projects, but are quite evenly split between them, all hosting 18 to 23%. While not an official geographical region, Latin America (or LATAM) hosts more than 40% of worldwide projects, mainly thanks to Mexico joining the South American pack. Africa follows with nearly 13% of projects, and Asia lags with just about 4.5%.
The surprisingly low VBM activity in Asia is difficult to explain. Here might be some reasons for it:
The region is still focused on economic hyper-growth, at least much more than the rest of the world: annual GDP growth hits nearly 5% for Asia, while most advanced economies hover at around 1.5%. Hence, nature protection could be pushed aside for its lack of direct profitability.
Southeast Asia alone has been estimated to hold 30% of the global potential for carbon offsets from NbS by 2050. Developers would then - quite logically - prefer an established and relatively stable market to a nascent one. Carbon might actually be a blocker for biodiversity in this region.
The region’s nature market policy is fragmented or indirect. The EU has the Nature Credits Roadmap, Oceania has Australia’s Nature Repair Market, and nearly all Latin American countries are developing state-level compliance schemes (Colombia, Chile, Brazil…). Asia, however, has not launched any similar endeavors.
Project size reshuffles the leaderboard:
Mexico, the top country by project count (20; 15% of total) falls to the 4th position by project size (102k ha; 4% of total) due to its 5,600 ha average, significantly below the global average (19,000 ha).
Ecuador, ranked 12th by project count (4; 3% of total), now holds the 7th position by project size (89k ha; 3.5% of total) thanks to its 22,244 ha average, above the global value.
Peru takes the 1st position thanks to its unique and immense project Sierra del Divisor, by far the largest project in the dataset with more than 1.3m ha. More on that later.
Europe claims 20% by count and only 3% by size due to its 3,000 ha average project size, the smallest region-level value. Land ownership and use are highly fragmented, and opportunity costs are higher than in regions like Africa, so continuous large projects are harder to put together.
South America still sits as the top region by both count and size, with respectively 24% and 71% of the total share, thanks to favorable regulations, high land availability and low operational costs. LATAM pushes it even further: 40% of all projects and 77% by size, for the same reasons as South America.
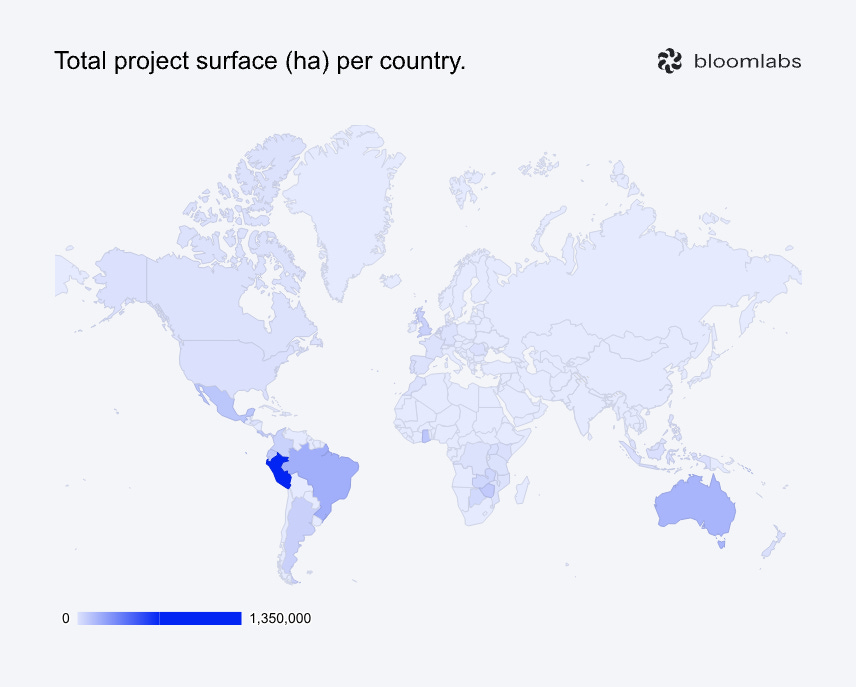
As credits are mostly issued on a per-surface basis, the project size indicator matters greatly in this analysis. This is why we will, from now on, always take it into account. From this perspective, the market concentration is clear: the top 10 countries worldwide host nearly 90% of all projects’ hectares. Nearly 90% of all credits issued also come from the top 10 countries.
Australia, Brazil, and Mexico stand out from the crowd with a cumulative 36% projects by count and 17% by size. The trio dominates credit issuance with nearly 60% of the worldwide volume - Australia alone accounts for 35% thanks to Wilderlands (more on that later). These countries have immense land surfaces, rich biodiversity hotspots, favorable jurisdictional capacities, and experience from carbon markets. Australia has already launched its national voluntary market (the Nature Repair Market), and Brazil’s regional governments are heading the same direction: the state of Paraná launched a public call for its biodiversity market with BRDE Bank committing to buy credits (source, p.13).
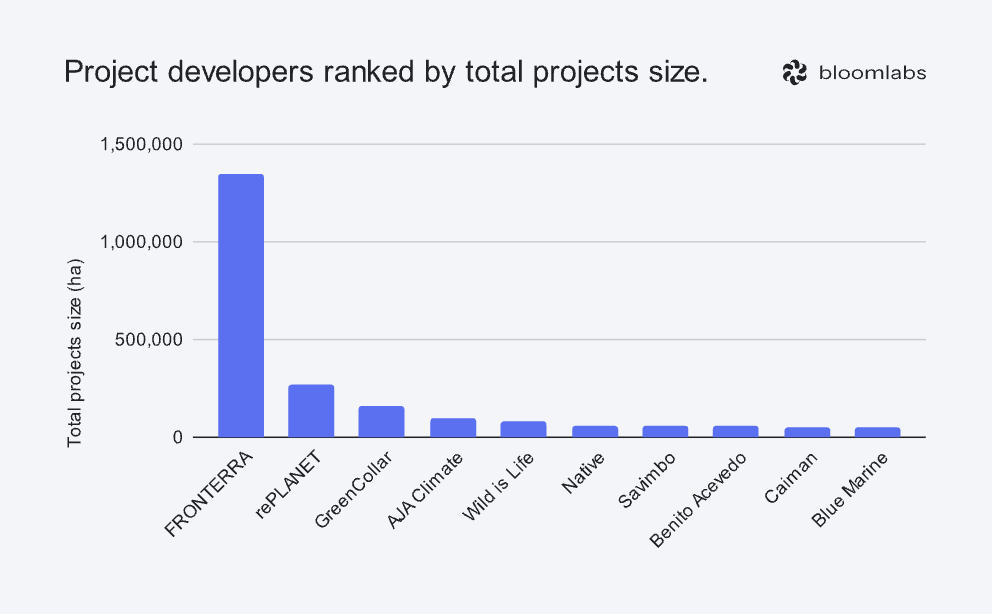
However, the real size winner is not in this trio. The Sierra del Divisor project, located in Peru and developed by FRONTERRA, is the largest project of our dataset by a magnitude of 10. Financed by Restore, a French asset manager funding biodiversity restoration and conservation projects, it has already gathered more than $1.2m in investments from diverse corporates, including French luxury brands. The project is currently registered under a national scheme (MERESE, and Restore is in discussions with different international standards to allow complementary registration.
Size and Activity
This section will cover activity terminologies created by the Biodiversity Credit Alliance (BCA):
Uplift is the improvement in biodiversity (restoration).
Avoided Loss is the prevention of decline in biodiversity (preservation).
Maintenance is the conservation of intact biodiversity (preservation with more flexible additionality criteria).
Since we consider work in productive landscapes as an important activity subcategory in VBM, we have added Sustainable Use to categorize the improvement of productive landscape management resulting in uplift or avoided loss, and signal the difference from natural landscapes.
Projects are categorized by their primary intervention: Uplift, Avoided Loss, Sustainable Use, and Maintenance. Nearly half of them combine multiple activities. Uplift is by far the most represented (mentioned in 71% of projects), followed by Maintenance (40%), Avoided Loss (25%), and Sustainable Use (25%).
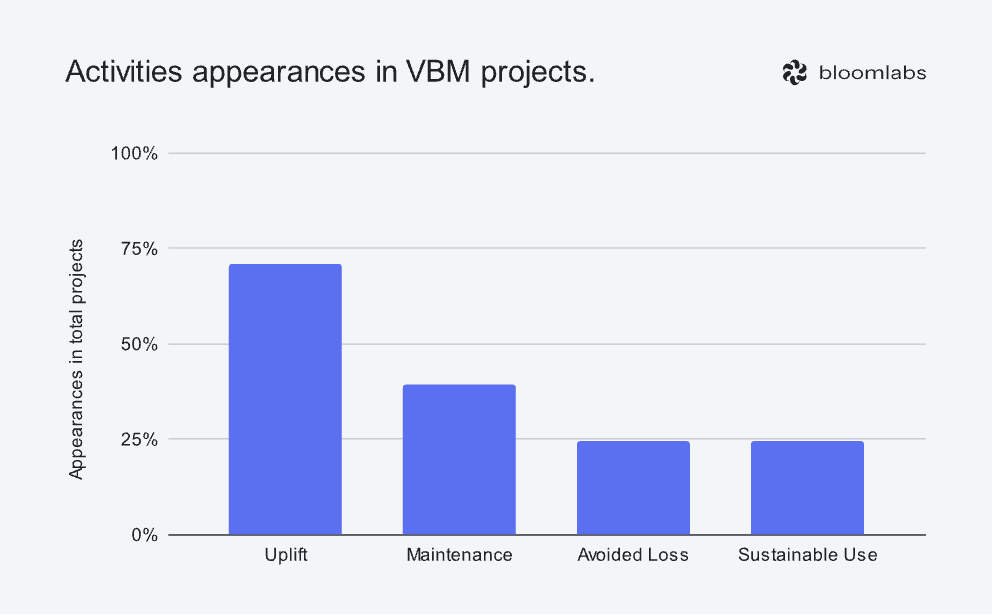
This restoration (Uplift) bias is not new. Restoration projects are more tangible and easier to measure, setting the perfect ground for a market where additionality becomes less of a concern and where buyer interest increases even at higher prices. Because restoration projects are much more expensive to develop (on a per hectare per year basis), they tend to be smaller (avg. 4,800 ha) than preservation projects (avg. 9,000 ha for Avoided Loss and 19,200 ha for Maintenance). As a result, Uplift only affects 30% of all covered hectares.
Biodiversity credit projects today are relatively comparable to nature-based projects in the voluntary carbon market (averaging 23,000 ha). While the top 10 projects cover 75% of the total hectares, and the top 20 claim 86%, almost a third cover less than 100ha each. The average project size of 19,200 ha contrasts with the 1,000 ha median: 9 projects exceed the 50k ha threshold, pulling the values up. More than 40% of all projects sit in the 100-10k ha zone, with a spike in the 1k-2.5k ha and the 5k-25k ha zones.
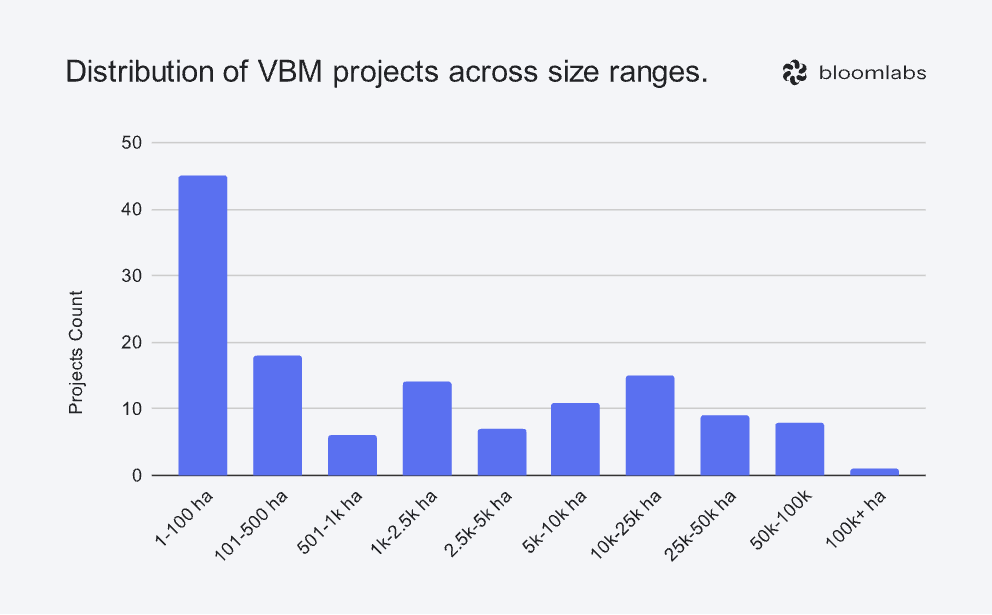
Under the 1k ha threshold, 32% of projects are pilots, compared to 19% in the whole dataset. The average pilot size is 6,200 ha, and their median sits at 100 ha (respectively 1,000 ha and 75 ha when removing the 2 extreme values). The average non-pilot size is 22,300 ha, and their median sits at 1,500 ha.
In the end, large landscape projects require capital, regulatory clarity, and community buy‑in - conditions that can be tricky to meet.
Are you a project developer? Explore our data partnerships where you can access parts of our premium platform in exchange for sharing your project, pricing and transaction data. Please contact us here.
Pricing
Disclaimer: Project pricing data is scarce. The findings presented below are limited to the priced projects in our dataset (28 out of 134).
The market is heterogeneous: the average credit price sits at around $230, with a $2 - $2,700 range and a $27 median. This is to be expected given its early stage: different conservation outcomes measured, area size, credit length, and geography are some of the key parameters explaining these variations.
The single most meaningful pricing metric is the cost per hectare per year of a given credit. It sits at around $3,100 today, ranging between $0.4 and $27,000. For a more realistic value, we can remove the three extreme items* from the list, getting a $980/ha/year final average value. Given that this market is a buyer’s market - where developers price their credits on a cost+ basis instead of a “true” biodiversity valuation - it provides context on how much it costs to implement the field actions.
*The Majete project in Africa pricing its credits at $2,700 for 1km2 protected during 1 year (high pricing and low time length), the BioVers project in Germany priced at $58 for 1m2 for 40 years (high pricing for a small credit size), and the Brönninghausen project in Germany pricing $4.2 for 0.2 ha for 50 years (low pricing for a regular credit size).
We also learn that a distinct relation exists between this cost and the size of its project: the higher the cost, the smaller the project, and vice versa.
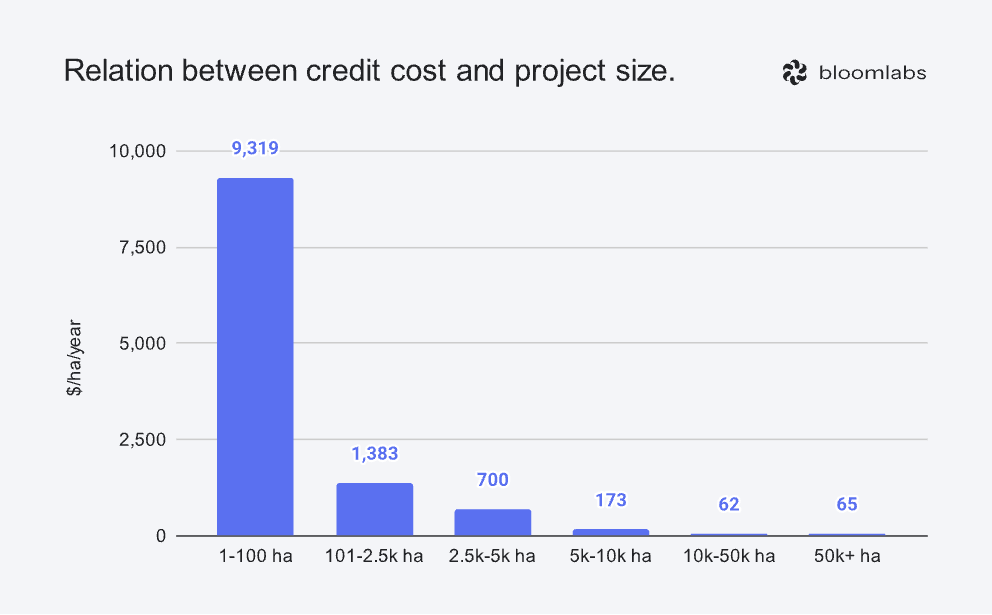
Two distinct phases can be identified:
From 1 to 10k ha, unit costs collapse as fixed costs are diluted over more hectares in a classic economies of scale fashion. The 1k ha threshold seems to be the minimum size for non-pilot endeavors: large enough to compensate for the fixed costs of credit validation and issuance, but small enough to contain operational costs and limit financing needs.
From 10k ha onwards, the operating floor is hit between $60 and $100. Fixed costs are fully amortized and only variable costs that don’t shrink with size are left (field staff, landholder payments, restoration work, biodiversity monitoring, etc...).
The per hectare per year pricing averages also vary wildly between regions: while North America ($100) and South America ($429) both stand around the hundred mark, Oceania prices at $1,436, and both Europe ($7,250) and Africa ($15,000) go well beyond. These numbers should not be taken as is, for North America and Europe are heavily impacted by a single project each (respectively Darién and BioVers), and Africa is dominated by the extreme values of Majete.
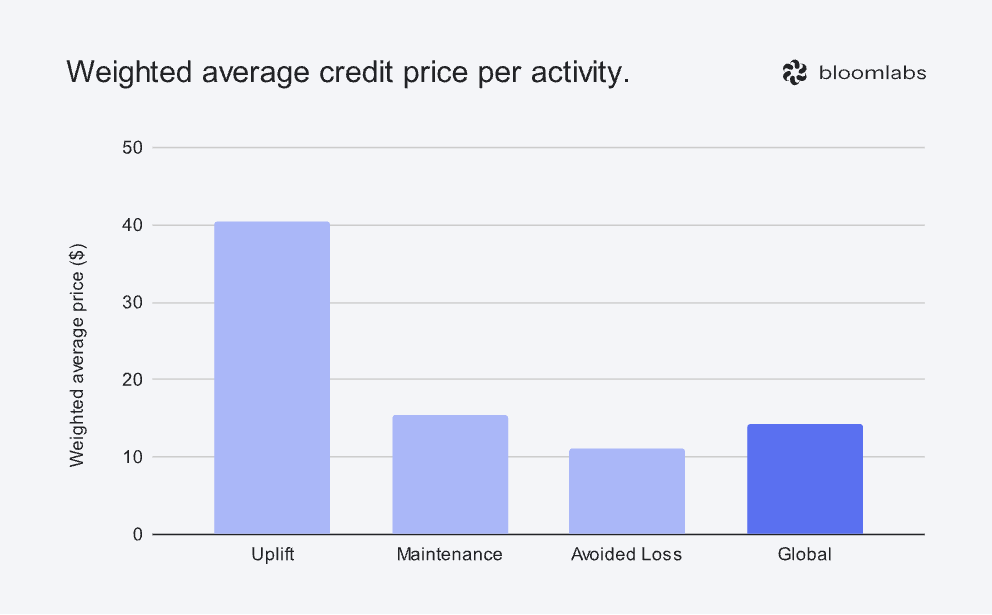
Taking the projects identified with only one activity, we obtain a weighted average credit price of $40 for Uplift (4 projects) $15 for Maintenance (5 projects), and $11 for Avoided Loss (5 projects). Even though data is still limited, the Uplift premium is explicit. Active restoration commands nearly 3× higher prices than preservation. The perceived additionality and storytelling strength (buyers seem to value measurable ecological gains over baseline protection) generate stronger marketing and impact claims, hence better returns.
Developers
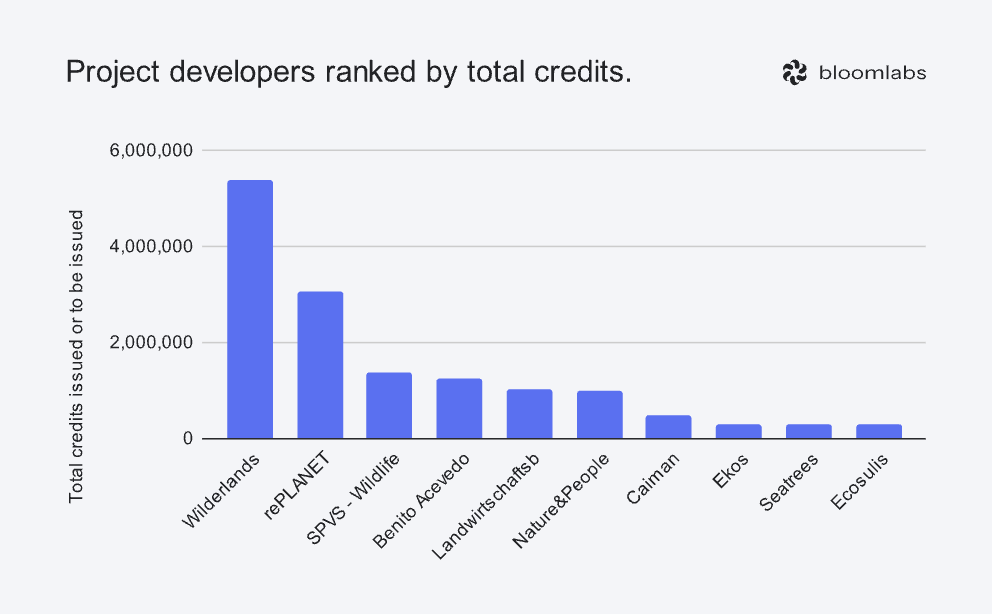
In the - very - concentrated developer market, 3 of them stand out: rePLANET accounts for the most identified projects (13 projects), FRONTERRA manages the largest surface size with more than 52% of the global share (Sierra del Divisor project, 1.3m ha), while Wilderlands is dominating credit issuance with more than 35% of the share, mainly thanks to their biodiversity credit specialization, early mover advantage and small credit size (1m2). By cross-referencing with our Transactions dataset, we also see that Wilderlands has sold more than $966k in voluntary biodiversity credits, representing more than 12.5% of all recorded sales.
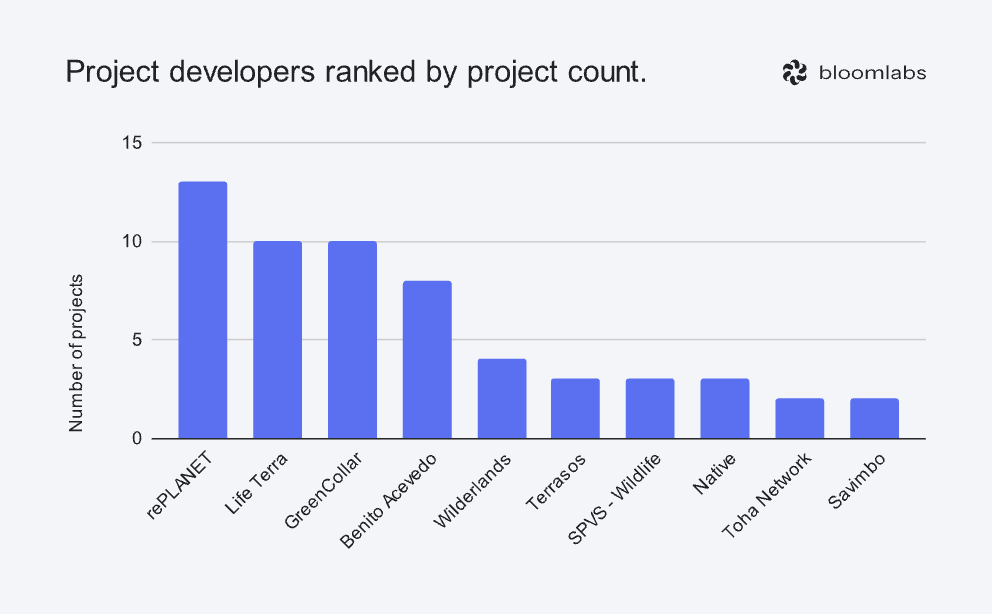
The 15 top developers manage more than 50% of the projects. Among them, the trio of rePLANET, Life Terra Foundation, and GreenCollar accounts for nearly 25%. Wilderlands, Terrasos, Native, Toha Network, Savimbo, and Ponterra also join the top 15. The top 15 also manage 94% of the total hectares. Under this perspective, new developers enter the top 15, such as Wild is Life, Blue Marine Foundation, ERA Brazil, or Bluebell Index. Finally, the credit issuance perspective gives little space for true competition at the moment: the top 7 developers issue more than 90% of the credits in the market with players like Caiman, Ekos or Seatrees.
Some players, such as Wilderlands and Terrasos, combine the roles of scheme and developer. They design methodologies and use them to develop their projects and generate their credits. It allows faster market entry and greater control over implementation, but it also lacks the authority of established standards (especially the ICROA-certified ones). As a result, these hybrids are driving early sales and experimentation, yet it remains uncertain whether the broader market (particularly large corporate buyers) will adopt their credits in the long run.
Schemes
The Scheme category is an umbrella term for different biodiversity credit systems (standards, frameworks, methodologies, programs). Standards and frameworks create extensive sets of rules on how to develop biodiversity credit projects, while Methodologies mostly cover specific subsets of these rules (especially for biodiversity quantification and credit calculation). More on that in our Voluntary Biodiversity Market analysis.
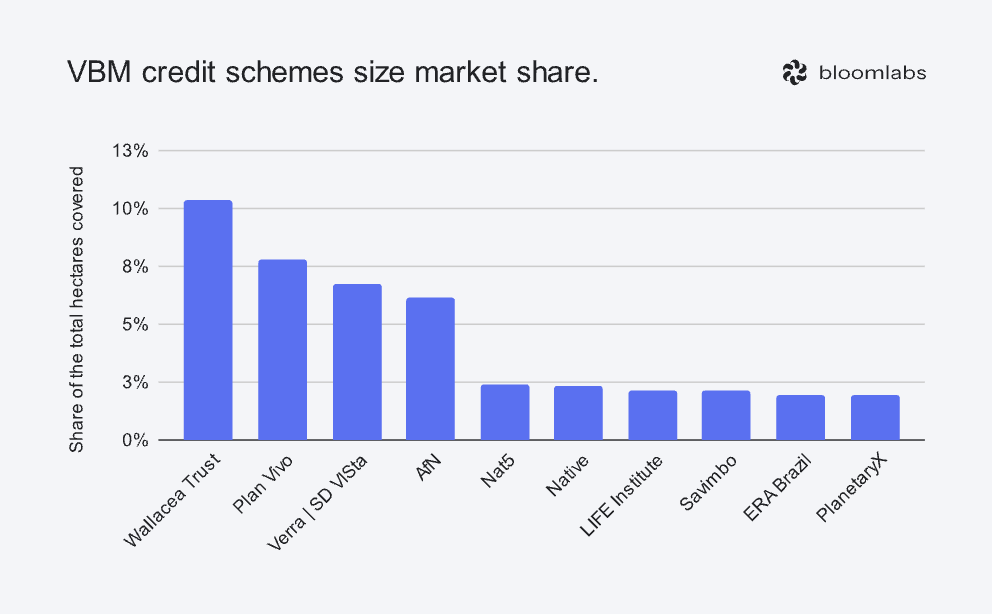
The schemes scene is, like the developers’ one, highly concentrated. Of the 35 schemes associated with current projects, the top 10 make up for 71% of the project count, 44% of the total hectares, and 96% of the credits issued.
Four schemes stand out from our database: Verra | SD VISta Nature Framework, Plan Vivo | PV Nature, Accounting for Nature | NaturePlus®, and Wallacea Trust. Together, they hold more than 37% of the projects and nearly 31% of the total project size in the market. However, they only account for 20% of the total credits issued, a space once again dominated by Wilderlands with its 35% market share, while covering less than 0.1% of the total hectares and 3% of the total project count. Except for the Wallacea Trust, which entered the market in 2022, their long development process explains this paradox by preventing fast market adoption. But they might turn the tables once they start issuing credits.
A global trend emerges, as non-ICROA-certified schemes like Nat5 (number 1 by project count with 19%) scale rapidly. Their lighter certification procedures allow for faster deployment compared to initiatives pursuing third-party recognition and alignment. This speed advantage helps early entrants capture market share, but might not secure long-term commitments from large corporates.
Are you a project developer? Explore our data partnerships where you can access parts of our premium platform in exchange for sharing your project, pricing and transaction data. Please contact us here.
Links to carbon
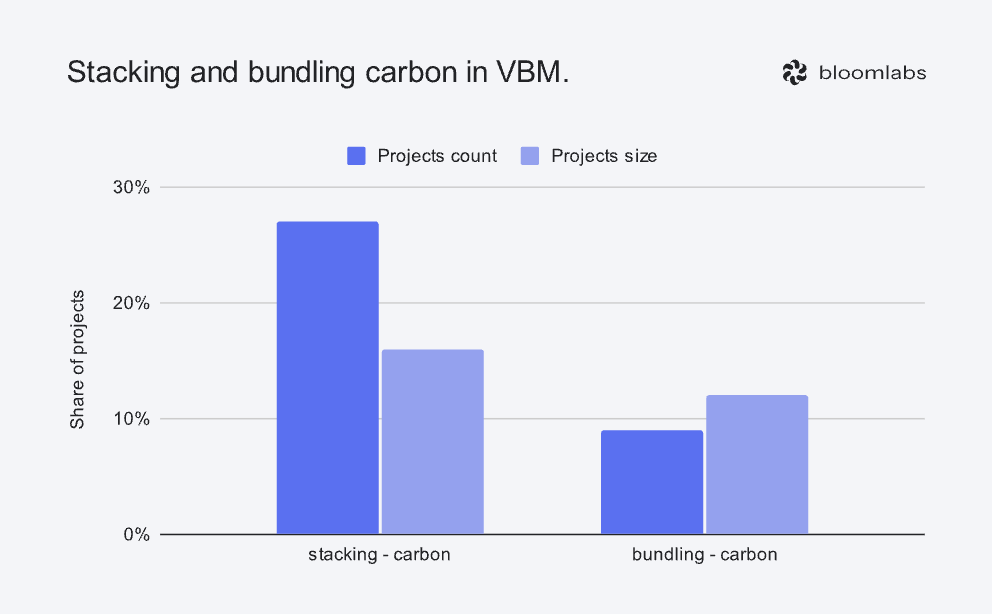
Let’s talk about the stacking and bundling of biodiversity and carbon credits. Credit stacking is the addition of different environmental credit outcomes on top of each other from the same piece of land. It allows these credits to be sold as separate outcomes to separate buyers. On the other hand, credit bundling is the combination of environmental credit outcomes from the same piece of land into the same credit. Its core difference from credit stacking is that the resulting credits cannot be sold separately. These two practices are among the best indicators to judge the connectedness of nature markets.
Both stacking and bundling value different ecosystem services originating from the same plot of land to achieve higher revenues per unit and, as a result, increase the land’s total value. Combining biodiversity with carbon helps VBM scale faster by using the existing carbon market infrastructure instead of developing a separate market.
Of the 134 projects identified, 27% reported stacking with carbon. This represents roughly 16% of the total hectares covered worldwide. Only 9% of projects engage with carbon bundling, but cover 12% in total size. The average project size when carbon stacking is used sits at around 11,500 ha, far from the 22,200 ha carbon bundling average.
Even though bundling generates fewer additionality concerns and measurement complexity than stacking, it is still a lot less popular amongst developers, with only 4 of them using it. The sales flexibility is one of the reasons: in a tense market where every sale counts and capital is hard to come by, the value of a given land plot must be maximized to its fullest. If a developer can extract 50% more value by selling a carbon credit and a biodiversity credit separately, even though it would require more effort than bundling them, they will do it.
We also see continued significant interest from carbon project developers regarding VBM:
“We are involved in the carbon markets. Biodiversity is something that we would be open to explore for the foreseeable future as a longer-term opportunity.” German project developer, October 2025.
“For the moment, we only develop NBS carbon projects, but we have internal discussions on how we could integrate the biodiversity space once it has matured.” French project developer, October 2025.
“We plan to enter the biodiversity credit market with Verra.” American project developer, October 2025.
“We think that we can actually bring value to our customers by creating nature credits.” Israeli project developer, October 2025.
These quotes have been anonymized to respect the developers’ strategic decisions.
Case study - Alleena
First of all, we would like to thank Wilderlands for having submitted their data to our platform.
Snapshot
Developer / Scheme: Wilderlands
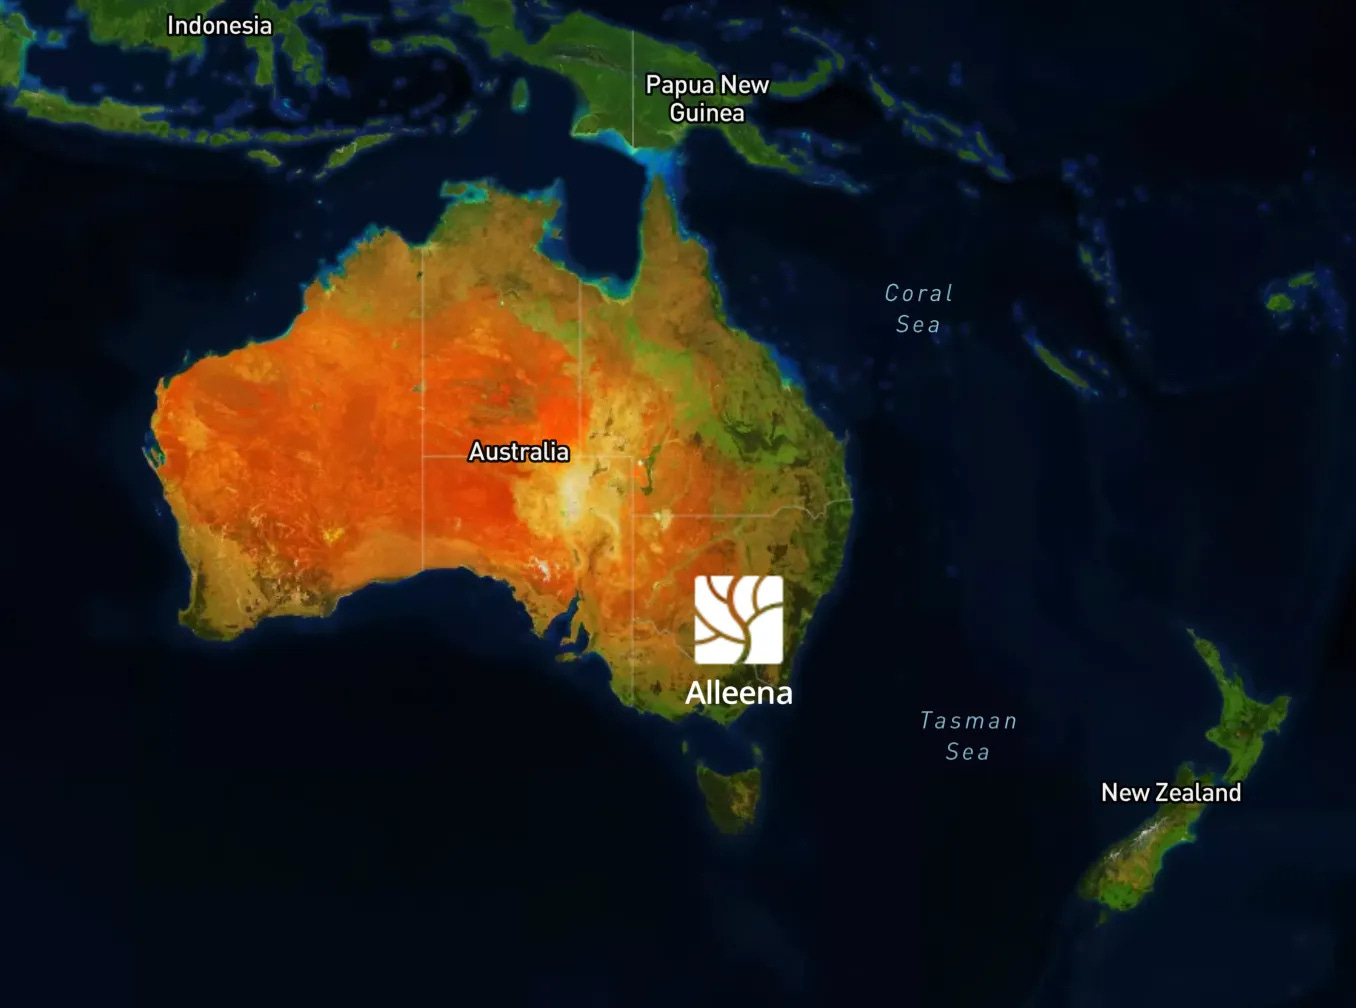
Location: Riverina, New South Wales
Activity: Avoided loss (protecting intact habitat)
Status: Credits issued
Site size: 497 ha
Unit: 1m² per credit (0.0001 ha/credit)
Credits: 4,015,828
List price: $1.97/credit
Crediting period: 20 years
Interest
The Alleena project, developed by the Australian developer and scheme Wilderlands, provides landscape-scale connectivity to support species movement and dispersal, as well as vital habitat for a range of threatened woodland birds.
Wilderlands is positioning its Biological Diversity Units (BDUs) as a way to get more business for buyers. The credits are used to increase product demand (e.g., by increasing ticket sales to Adelaide Festival or helping sell limited edition products of al.ive body) and help meet regulatory requirements in the real estate sector.
Wilderlands’ market traction, nearing $1m in sales, proves their agility in looking for new demand sources. They can be considered as early experimenters and provide the market with valuable lessons.
Leveraging Bloom
Using our market intelligence platform, you can:
Calculate the cost per hectare per year from our premium data: $985. Use it to benchmark against other projects in the region.
See the full pricing context: Pull the project-level pricing, credit size and credit length across comparable projects to gather the full picture.
Quantify exposure: Use Premium’s fields to model ha-years purchased (not just credits), so finance teams can compare biodiversity purchases with conservation or carbon options.
Track the developer: Cross-reference the Wilderlands organization profile - other projects, alliances, and recent activity - to assess delivery risk. For example, knowing that Wilderlands has reached nearly $1m in sales is a significant indicator of its reliability.
Conclusions
Is this a market?
The voluntary biodiversity credit market is entering a new phase. After more than two years of fragmented experimentation, we’re now seeing early signs of consolidation in geography, methodology, and developer landscapes. The post-GBF momentum has translated into the beginning of scale, with 134 projects covering over 2.5 million hectares, yet market concentration is emerging fast. This is good news: structure is forming.
Project activity-wise, restoration leads the market by total appearances while preservation still holds the largest land footprint. The two play different yet complementary roles. One provides an easier proof of additionality and generates buyer appeal, the other anchors large-scale ecological stability. The market will need both for credible and scalable growth.
Pricing data is still noisy, but patterns are starting to emerge. The average credit price sits at around $230, though per hectare per year costs at $980 provide a clearer signal. Restoration activities command a consistent premium over preservation, confirming that buyers seek “tangibility”. Benchmarking using standardized metrics will be key to meaningful price discovery.
A handful of schemes and developers dominate issuance and value, typical of emerging markets. Fast-moving, non-certified schemes may lead adoption, but established ICROA-certified standards might ultimately set the long-term requirements, quality standards and, most importantly, attract consistent corporate demand.
Biodiversity and carbon are converging. More than one in four projects now stack both assets, while bundling is gaining traction (around 10% of projects). This trend shows the market’s pragmatic turn: biodiversity is progressively integrated into broader nature portfolios as a complementary asset.
Bottom line: this market is steadily maturing.
A viable path onwards?
At the end of the day, what matters most is whether the biodiversity credit project achieves real, verifiable, and additional ecological outcomes. But to make a market work, it also has to fulfill the needs of the buyers. And since buyer-side questions are still mostly unanswered, it becomes crucial to strategically co-develop the early biodiversity credit pilots with them.
As a result, corporate biodiversity credits (CBCs) are becoming a more established concept, where projects are designed with corporates from the start. Developers de-risk their operations with commitments to purchase from companies that, in return, can shape the projects to their needs (supply-chain protection, reporting purposes, specific nature strategy goal alignment, or even direct integration into their products).
And we can already see how beneficial this approach is. Through our participation in the EU LIFE program to pilot biodiversity credits in wetland conservation, alongside NABU, Eurosite, Aeco, ELO, and Sylva, we are witnessing how starting with an identified and engaged buyer (in this case, VFWS) can help make the project more valuable to every stakeholder.
Where do we go from here?
This deep dive is just a snapshot. Our database will evolve as new projects appear and existing ones mature. And as more data becomes available, we will be able to provide deeper insights.
One thing is certain: clarity, comparability, and credible data are becoming the main currencies of trust. That’s exactly what we’re building with Bloom, a single source of truth for nature finance.
If you’re developing a biodiversity project or know of one that should be listed, please contact us here. And if you want to explore the data yourself, visit app.bloomlabs.earth and dive into our dashboards, made with love by Tassilo, curated with care by Simas and Martin.
See you on the next deep dive.
The bloomlabs team.
 | A guest post by
|